We report three NOAA/NASA datasets
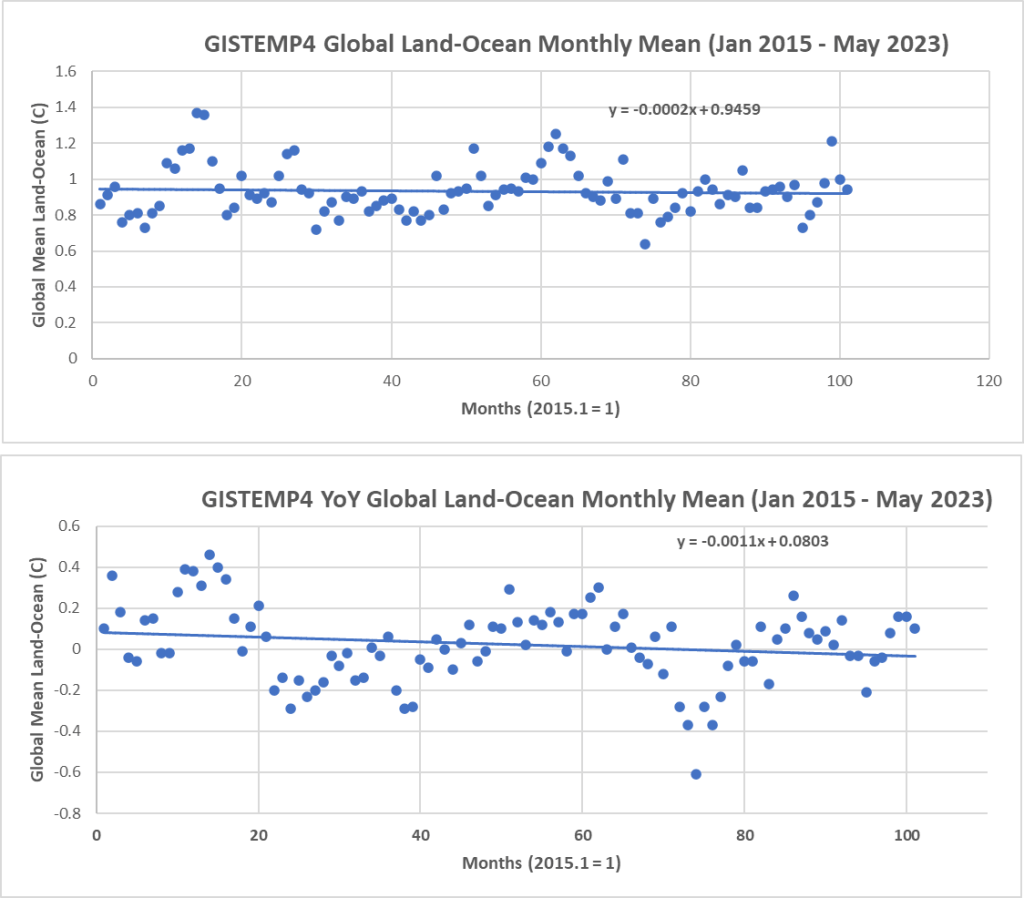
- GISTEMP: The GISS Surface Temperature Analysis version 4 (GISTEMP v4) is an estimate of global surface temperature change. Graphs and tables are updated around the middle of every month using current data files from NOAA GHCN v4 (meteorological stations) and ERSST v5 (ocean areas), combined as described in our publications Hansen et al. (2010) and Lenssen et al. (2019). These updated files incorporate reports for the previous month and also late reports and corrections for earlier months.
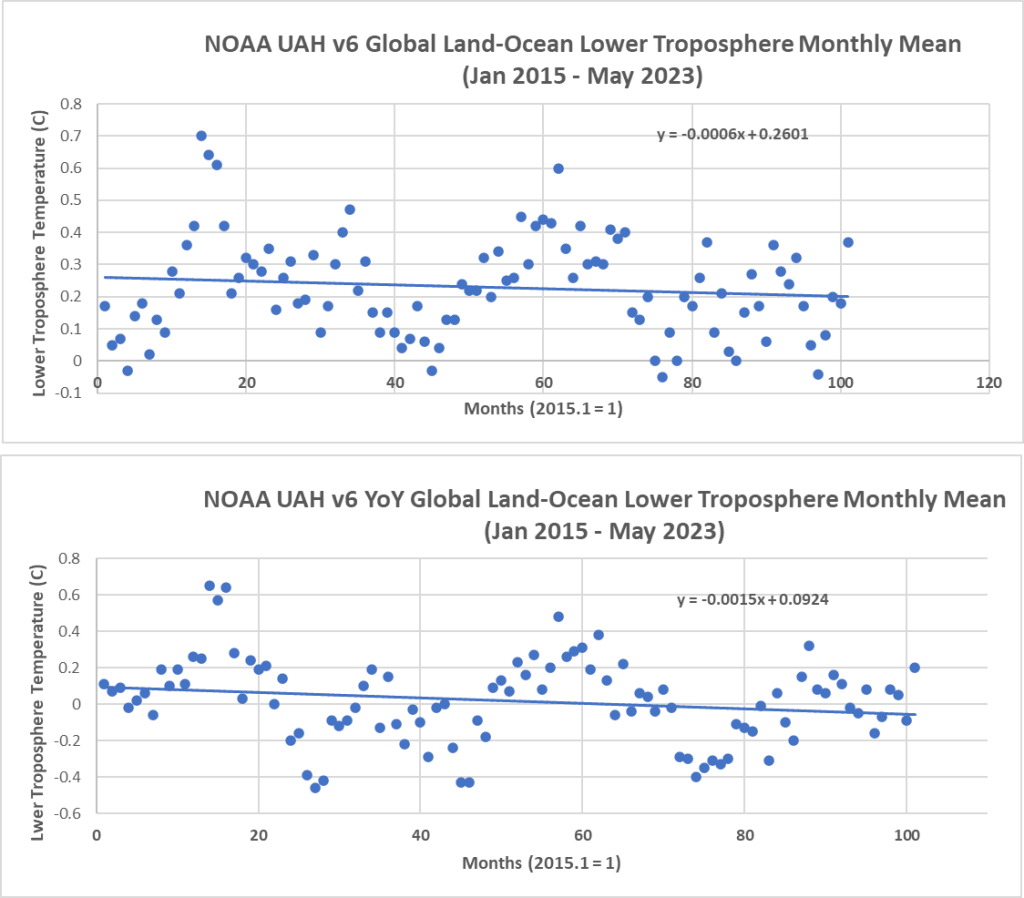
- UAH: This dataset includes monthly gridded temperature anomalies on a global 2.5 x 2.5 degree grid derived from Microwave Sounding Unit (MSU) and Advanced Microwave Sounding Unit (AMSU) radiance data since December 1978. In addition, there are monthly regional anomalies and monthly mean annual cycle temperatures. All products are derived for four bulk layers of the atmosphere: the Lower Troposphere (TLT), Mid-Troposphere (TMT), Tropopause (TTP) and Lower Stratosphere (TLS). Version 6.0 is the latest UAH version archived at NOAA and is updated monthly. It utilizes the linear calibration equation with hot-target correction for the MSU series (TIROS-N through NOAA-14) rather than other non-linear calibration equations. We report the TLT dataset.
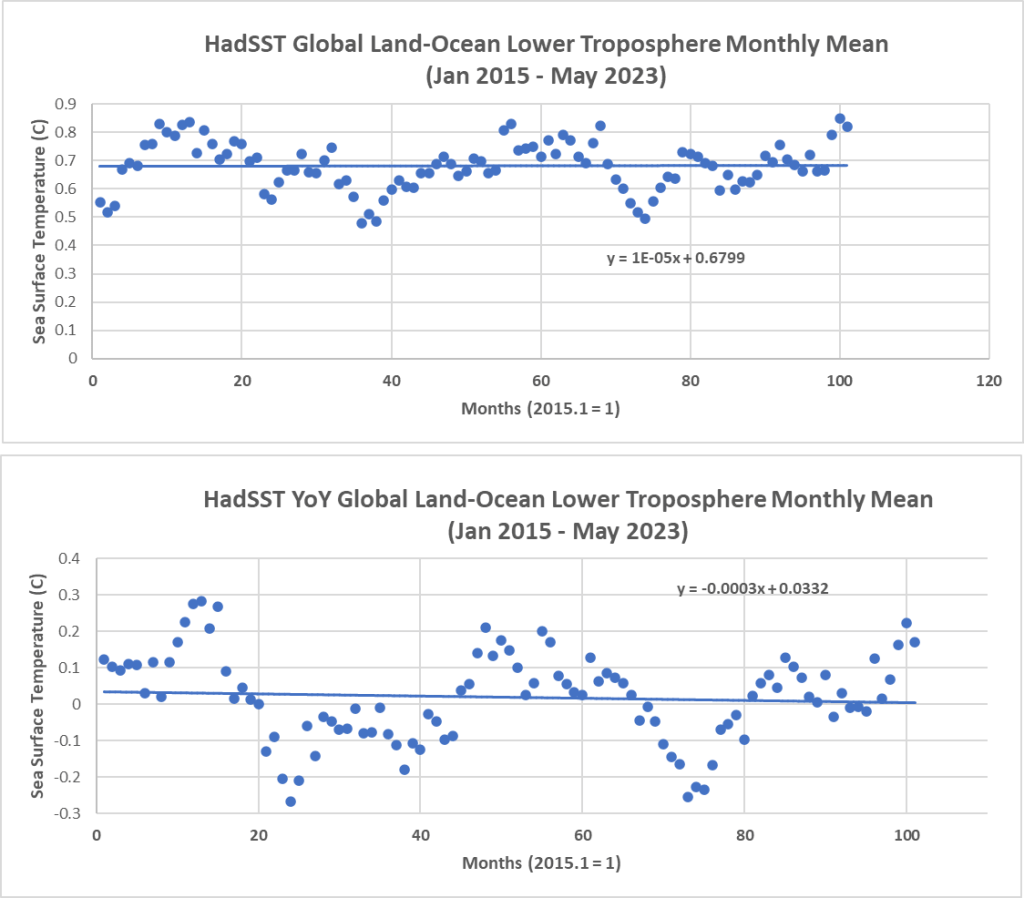
- HadSST: HadSST4 provides monthly sea surface temperature (SST) anomalies on a 5°x5° grid for 1850-present. The anomalies are derived from a 30-year climatology spanning 1961-90. Coverage is global but there is no interpolation;
These plots focus on the period after 2014.
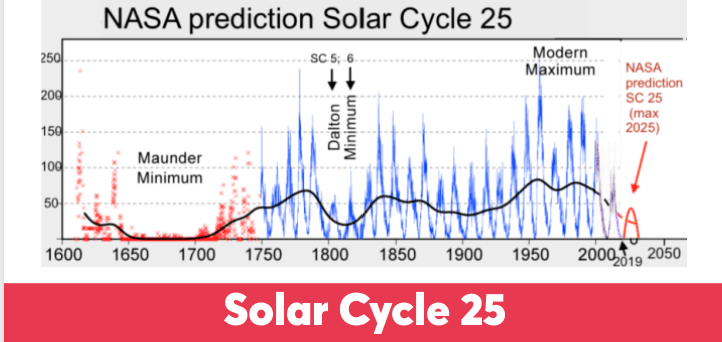
Why 2014?
Because the ~80 yr long active solar (warming) Gleissberg ended in 2014 with peak Solar Cycle 24.
GISTEMP
UAH
HadSST