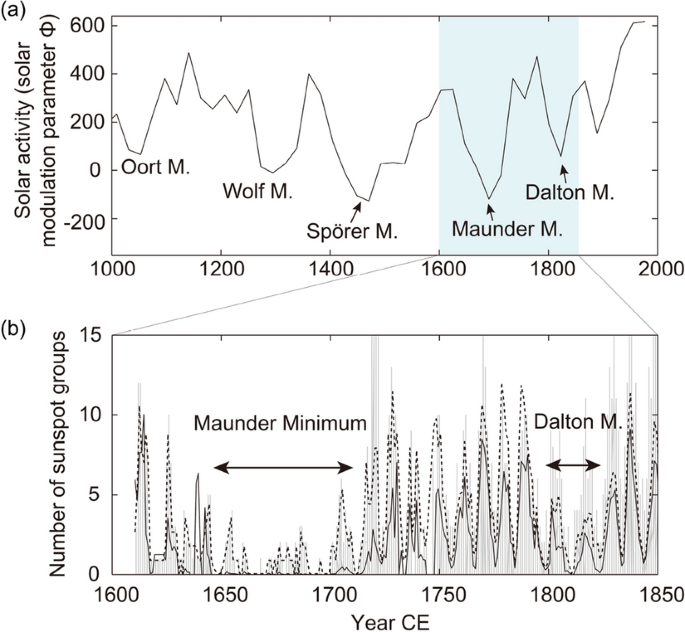
The Maunder Minimum, also known as the “prolonged sunspot minimum”, is the name used for the period around 1645 to 1715 during which sunspots became exceedingly rare, as was then noted by solar observers.
The term was introduced after John A. Eddy published a landmark 1976 paper in Science. Astronomers before Eddy had also named the period after the solar astronomers Edward Walter Maunder (1851–1928), and his wife Annie Russell Maunder (1868–1947),who studied how sunspot latitudes changed with time. The period which the Maunders examined included the second half of the 17th century.
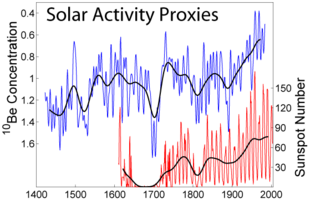
Two papers were published in Edward Maunder’s name in 1890 and 1894. He cited earlier papers written by Gustav Spörer Spörer noted that, during a 28-year period (1672–1699) within the Maunder Minimum, observations revealed fewer than 50 sunspots. This contrasts with the typical 40,000–50,000 sunspots seen in modern times (over similar 25 year sampling).
Let’s put some context to the historic record.

The Maunder Minimum occurred with a much longer period of lower-than-average European temperatures which is likely to have been primarily caused by volcanic activity.
In the current era, substantial research money has gone into the role of greenhouse gas concentration (GHG) in driving up climate temperature since 1850. The International Panel on Climate Change (IPCC) reports GHG has been rising since the mid-19th century and attribute that rise to European and North American industrialization that went global by the mid-20th century.
Yet, it’s important to note that GHG merely amplifies the primary driver of temperature: solar irradiance.
As demonstrated below, solar irradiance has been rising since 1850, coincidental with GHG. The rise in solar irradiance is known as the Modern Maximum.
The Modern Maximum refers to the period of relatively high solar activity which began with Solar Cycle 15 in 1914. It reached a maximum in Cycle 19 during the late 1950s and may have ended with the peak of Cycle 23 in 2000, as Cycle 24 is recording, at best, very muted solar activity. Another proposed end date for the maximum is 2007, with the decline phase of Cycle 23. In any case the low solar activity of Cycle 24 in the 2010s marked a new period of reduced solar activity.
This maximum period is a natural example of solar variation, and one of many that are known from proxy records of past solar variability. The Modern Maximum reached a double peak once in the 1950s and again during the 1990s.
Does that mean GHG drive up temperature? Or, does rising temperature increase GHG?
Well, let’s check satellite data for the lower troposphere.

Here, we see temperatures dynamically stall from around 2000-2015, followed by a late decade peak. We now see a leg-down, similar to 2018. So far, 2021 has been “off the charts” cold.
NASA announced late in 2020 the beginning of Solar Cycle 25 following the solar minimum in December 2019, The Sun’s activity is expected to peak in July 2025. NASA expects Solar Cycle 25 to be as strong as the last solar cycle, which was a below-average cycle.
Miyahara et al. (2021) found that a 16-year long cycle occurred three solar cycles before the onset of prolonger sunspot disappearance. They argue that Solar Cycle 23’s lengthening suggests the potential for a minimum occurring as early as Solar Cycle 25.
References:
Miyahara, H., Tokanai, F., Moriya, T., Takeyama, M., Sakurai, H., Horiuchi, K., & Hotta, H. (2021). Gradual onset of the Maunder Minimum revealed by high-precision carbon-14 analyses. Scientific Reports, 11(1), 5482.
Potter, S. (2020). Solar cycle 25 is here. NASA, NOAA scientists explain what that means. Retrieved from https://www.nasa.gov/press-release/solar-cycle-25-is-here-nasa-noaa-scientists-explain-what-that-means
