Citation: Le Mouël, J. L., Lopes, F., & Courtillot, V. (2020). Characteristic time scales of decadal to centennial changes in global surface temperatures over the past 150 years. Earth and Space Science, 7, e2019EA000671. https://doi.org/10.1029/2019EA000671
Le Mouel et al., 2019:
- applied spectral analysis to the four main data sets of global surface temps (1850-2017)
- found spectral periods typical of solar activity variation
- results consistent with most surface variability is natural and primarily solar-driven
Abstract:
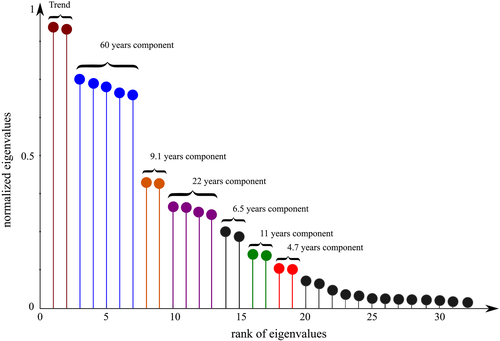
We apply singular spectral analysis (SSA) to series of monthly mean values of surface air temperatures T, International sunspot number (ISSN), and polar faculae PF (1850–2017 for T and ISSN). The efficiency of the SSA algorithm that we use has been regularly improved. For the T, ISSN, and PF series, the SSA eigenvalues and first components are shown with their Fourier spectrum. Components of T, ISSN, or PF share similar periods. Most are found in solar activity. The ~22- and ~11-year components are modulated and drift in phase, reflecting slight differences in spectra. On the shorter-period side, components at ~9, ~5.5, and ~4.7 years are in good agreement. They have been identified in solar activity. The 60-year component is prominent in T. It is not immediately apparent in ISSN but can be extracted with an appropriate choice of SSA window. Other types of data allow one to explore longer periods and confirm climatic variations at ~60, ~35, and ~22 years and at 50–150 and 200–500 years. When we consider a longer ISSN series starting in 1700 and recalculate the SSA first component, the trends of solar activity and temperature over the time span from 1850 to 2017 are very similar, with slower rise before 1900 and after the late 1900s, separating a faster rise in much of the twentieth century. These trends, extracted over only 150 years, could be parts of longer, multicentennial changes in solar activity. Much of the variability of surface temperatures could be linked to the Sun.
This paper triggered one comment: Cuypers, Y., Codron, F., & Crepon, M. (2021). Comment on “Characteristic time scales of decadal to centennial changes in global surface temperatures over the past 150 years” by J. L. Le Mouël, F. Lopes, and V. Courtillot. Earth and Space Science, 8, e2020EA001298. https://doi.org/10.1029/2020EA001298
- No compelling results showing a significant covariability between sunspot amounts and temperature
- Radiative forcing associated with slow solar components (60 yrs, trend) is very weak over the past 150 yrs, and opposite trend in last 30 yr
Abstract (Cuypers):
Based on Singular Spectral Analysis (SSA) analysis of global earth surface temperature and solar activity (sunspots), Le Mouël et al. (2020, https://doi.org/10.1029/2019EA000671) suggest that the variability in Earth surface temperature observed since 1850 is natural and controlled by the Sun. We cannot agree with their conclusions for several reasons: the lack of compelling results from the Fourier spectra and SSA estimates which are provided without confidence intervals, the small radiative forcing associated with the sunspot variability, and finally the simple evidence that the slowly varying components of the temperature and sunspots time show opposite trends in the last 30 years.
Le Mouël responds
- Find compelling results showing a significant co-variability between sunspot numbers and global temp
- Offer no mechanism to explain that forcing
- Temp and sunspot trends are similar with the second component results opposing in the last 30 yrs
Abstract (Le Mouël)
We thank the authors (hereafter referred to as CCC) for providing us an opportunity to clarify some points of our original paper. CCC list in their abstract three “key points”that we respond to in this Reply. The first comment is the central one and the most developed. It deals mainly with discussion of features of methods of spectral analysis, mainly SSA. We have quoted the sub-parts of that comment as items 1a to 1k. The replies to comments/key points 2 and 3 are shorter. We disagree with most of the comments by CCC and explain why. We conclude that we have successfully countered CCC’s criticism and shown many of their points to be unsubstantiated. The main problem seems to reside in differences concerning the literature on Singular Spectral Analysis and our use of it. Much of our response to the comments can be found in textbooks and review papers on SSA and time series analysis; we quote extensively, both in our original paper and in this response to CCC, Golyandina and Zhigljavsky (2013).

The HadCrut series of global surface mean temperature anomalies from January 1850 to January 2017 (https://crudata.uea.ac.uk/cru/data/temperature/; monthly mean values). (bottom) Its Fourier spectrum.
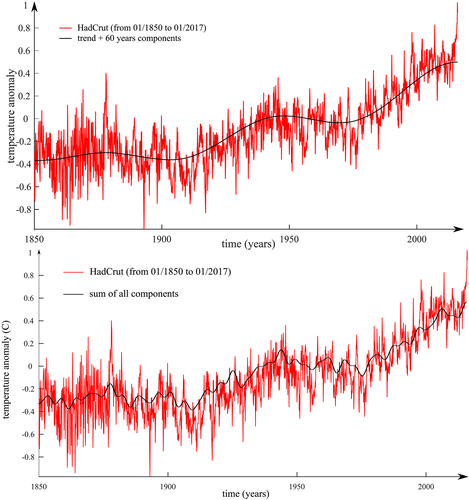
Reconstruction of the HadCrut series using only the first two eigenvalues/components from the singular spectrum analysis (trend and “60 years”). (bottom) Reconstruction of the HadCrut series using the first seven eigenvalues/components from the singular spectrum analysis.
