With the greatest global commodity shock dynamic propagating, it’s timely to examine the banking landscape at the water’s edge just before the tsunami sweeps in.
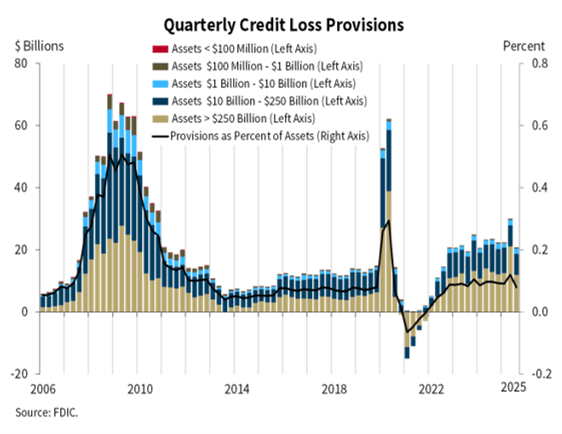
Per FDIC, the banking industry’s loss provision expense was $20.8 billion in the third quarter 2025, down $9.2 billion QoQ mostly due to Capital One’s acquisition of Discover Financial Services. Overall, loss provision decline would have been much less QoQ and YoY.
It’s a quiet time right now though things are starting to get interesting.
In the coming weeks and months, I’ll be following the Regionals through the Hormuz Shocks as they face their greatest challenge since the Great Financial Crisis.
Let’s set the stage.
From Great Financial Crisis to Covid
Credit shocks and reflation are a recurrent theme in the banking sector.
A decade later after the Great Financial Crisis and bank failures, the Covid macro shock was quickly followed by the failures of Silicon Valley Bank (SVB) and other regional banks (Regionals).
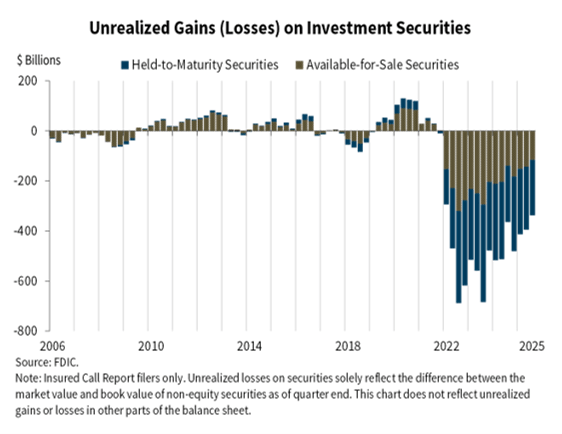
SVB failed in March 2023 primarily from interest rate risk on its securities portfolio — a held-to-maturity bond book that collapsed in market value as rates rose 525bps in 18 months and large uninsured depositors ran for the door.
SVB was not a one-time event. It cointegrates with the rising risk in the commercial real estate market (CRE), particularly the office sector collapse under remote/hybrid work policies introduced in the Covid era.
Like the subprime mortgages of the Great Financial, CRE credit stress and Regional bank risk are connected by the same root cause — the Fed’s aggressive rate cycle. The transmission mechanism is rising rates that simultaneously:
- compress securities portfolios (SVB’s direct problem)
- suppress transaction volume and refinancing activity in CRE markets
- increase debt service costs on floating-rate CRE loans at maturity or reset, and
- deflate property valuations as cap rates rise.
Banks that survived the securities mark-to-market problem — as many regionals did, notwithstanding Silicon Valley et al. — were then exposed to the second-order credit effect showing up in CRE charge-offs through 2023 and 2024.
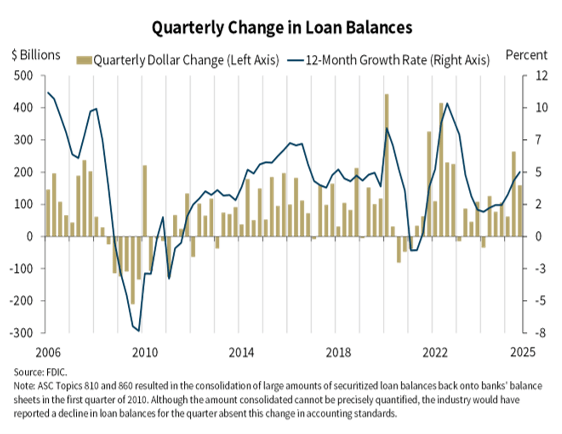
The Covid crisis removed several hundred billion dollars from bank balance sheets which was replensihed by Fed liquidity. But interest rate increases to curb inflation quickly reduced balance sheets for several years.
The Covid-SVB period also coincides with the Regionals’ adoption of the Current Expected Credit Loss (CECL) provisioning standard that came out of the Great Financial Crisis. CECL’s pro-cyclicality shifted the credit loss allowances (ACL) ahead of credit shocks.
The question we should see answered in the upcoming commodity shock is whether CECL is up to the task for protecting the Regionals.
CRE Dynamics Post-Covid
Post-Covid, CRE returns lagged other major asset classes for three years, largely due to falling property prices, prompting investors to recalibrate allocation targets lower.
Valuations appear to have hit bottom in 2025, with tightening supply and accelerating demographic tailwinds positioning several sectors for renewed strength.
The drivers of the earlier decline — which bled into 2025 — are well understood:
- Higher-for-longer interest rates. Interest rates remained above pre-pandemic levels, and stable assets carried borrowing costs significantly above historic lows, strengthening valuation discipline and leading to lower prices and reduced refinancing options
- CRE sector bifurcation. Office continued losing value, particularly in California, New York, and Washington, while industrial and logistics activity remained stronger in markets like Texas and Florida.
- Tariff and policy shocks. Increases in both tariffs and immigration restrictions raised costs for builders and developers throughout 2025.
- Investor reallocation. Through the end of June 2025, property sales activity in the Americas was up 12% year over year, suggesting a recovery trajectory, while European markets dropped 15% due to bond rate shifts and trade policy.
By late 2025 into 2026, conditions were improving: debt costs eased, lenders reentered the market, and deal activity picked up — with Q3 2025 sales volume up more than 40% year over year.
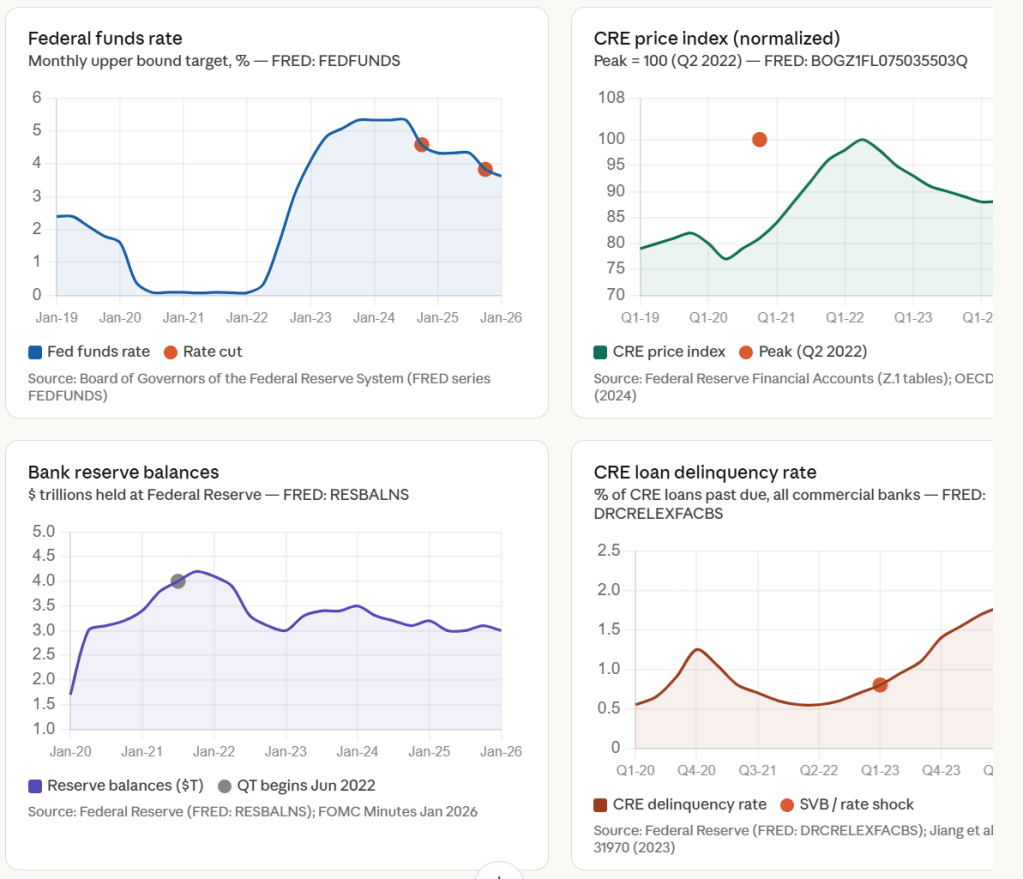
The short version: CRE price declines were largely a 2022–2024 story driven by rate hikes and office demand destruction, with 2025 being more of a trough/stabilization; and bank reserve rates have actually been cut, though reserve levels are being actively maintained at ample levels by the Fed buying short-term Treasuries.
Let’s review some key observations related to the CRE sector:
Claim 1 — CRE prices declined ~11% (US) from their mid-2022 peak, driven by rate hikes and structural demand shifts
The OECD Economics Department (Working Paper No. 1829, 2024) documents that commercial property prices in the United States declined significantly since their peak in mid-2022 — falling OECD 11% by late 2023 — driven by higher global interest rates and the adjustment to new demand patterns from teleworking and e-commerce.
Full citation: OECD Economics Dept. WP No. 1829 — “Commercial Real Estate Markets After the End of Low-for-Long: Risks and Policy Challenges” (December 2024). https://doi.org/10.1787/0f9ae118-en
Claim 2 — CRE’s ~25% share of average bank assets made it a systemic risk amplifier after rate hikes
Jiang, Matvos, Piskorski & Seru (NBER WP 31970, 2023) show that CRE loans represent about 25% of average bank assets, totaling $2.7 trillion, and that after property value declines from rising rates and the shift to hybrid work, 14% of all CRE loans and 44% of office loans were in negative equity — with a 10% default rate implying $80 billion in additional bank losses.
Full citation: Jiang, E.X., Matvos, G., Piskorski, T. & Seru, A. — “Monetary Tightening, Commercial Real Estate Distress, and US Bank Fragility” — NBER Working Paper 31970 (2023). https://doi.org/10.3386/w31970
Claim 3 — Rate-driven mark-to-market losses of ~$2 trillion in bank assets amplified CRE fragility
Extending the same mark-to-market methodology to Q3 2023, the analysis finds that almost half of US banks (2,405 institutions) accounting for $11.6 trillion of aggregate assets had negative capitalization when all non-equity liabilities were taken at face value — with additional CRE losses eroding remaining capital buffers and increasing the risk of runs by uninsured depositors. NBER
Claim 4 — REIT credit lines create a systemic risk channel between CRE and bank balance sheets
An NBER working paper on shadow banking documents that commercial property prices dropped about 21% since the Federal Reserve started raising interest rates in March 2022, with the correction erasing the property price appreciation over the preceding two years, and shows REIT utilization rates on bank credit lines spike markedly during periods of market stress — making credit lines to REITs a potentially significant source of systemic risk for banks.
Full citation: Acharya et al. — “Shadow Always Touches the Feet” — NBER WP 33590 (2025). https://www.nber.org/papers/w33590
Claim 5 — Bank reserve balances held near $3T; the Fed restarted T-bill purchases to maintain “ample” reserves
At its December 2025 meeting, the Federal Reserve approved new purchases of Treasury bills and coupon bonds at up to $40 billion per month for reserve management purposes — not quantitative easing — designed to provide an ample supply of reserves, with this operation expected to run until April 2026.
Primary source: FOMC Implementation Note, December 2025; FOMC Minutes January 27–28, 2026 (Federal Reserve). FRED series: RESBALNS.
Claim 6 — Office sector structural vacancy represents a long-run headwind distinct from the cyclical rate shock
The OECD paper further documents that in the United States, smaller and regional banks sharply increased the share of CRE loans in total loans since the pandemic, while the largest banks did not — and with more than half of CRE loans backed by commercial non-farm non-residential properties, they are particularly exposed to strained conditions in the office and retail segments.
Reserving Trends
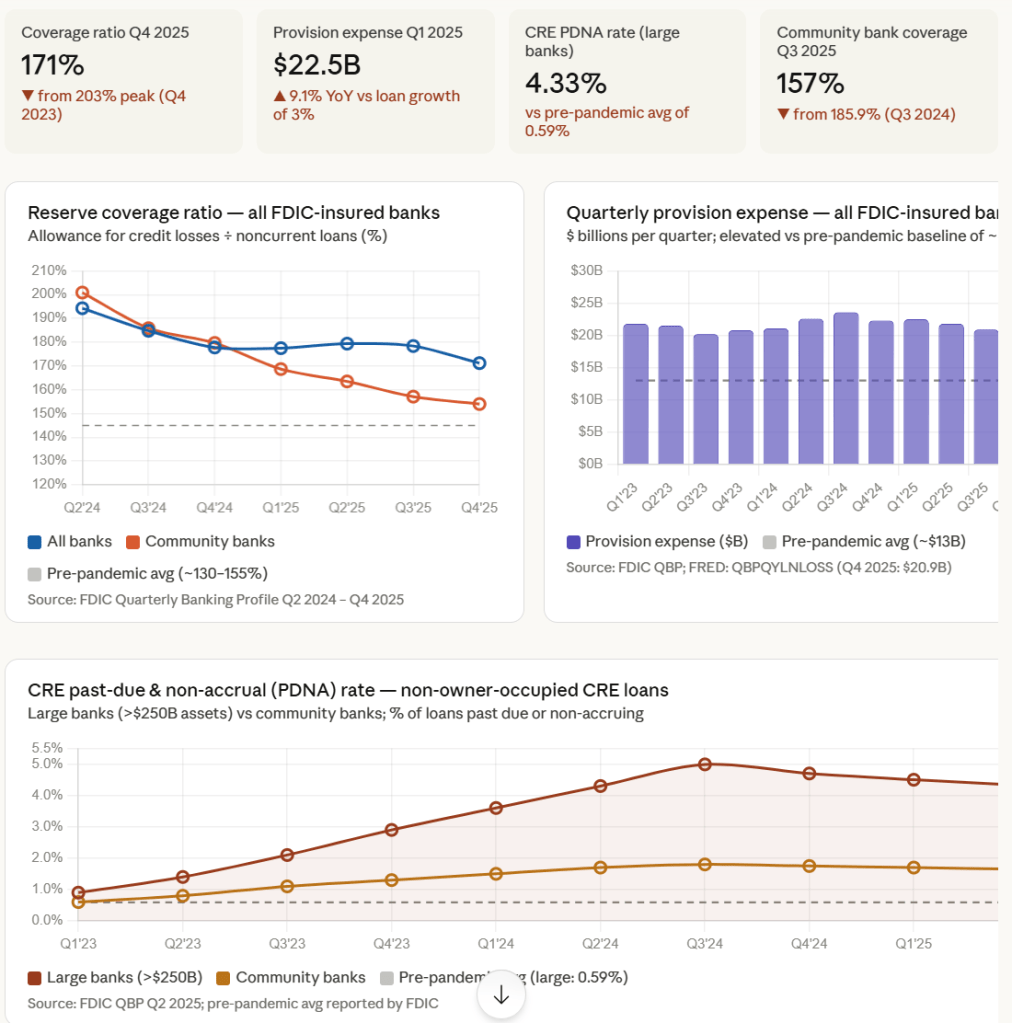
Here’s what FDIC reports. Note the widening gaps between large banks and community banks (with Regionals in between).
The story here has three distinct threads worth unpacking carefully.
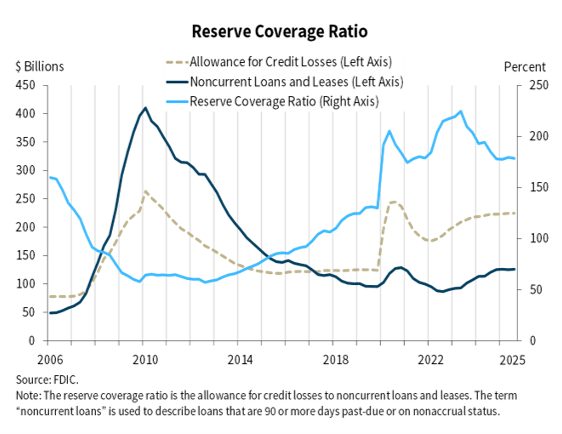
Thread 1 — Coverage ratio: declining from a post-pandemic peak, but still elevated
In 2023Q4, the industry coverage ratio — allowance for credit losses to noncurrent loans — was above 203%. Consistent declines have brought it to 177.5% as of Q1 2025. The most recent FDIC data show a further decline: in Q4 2025, the funded allowance for credit losses decreased slightly while noncurrent loan balances increased, resulting in a decrease in the reserve coverage ratio to 171.2%.
The mechanism driving this is not that banks are releasing reserves aggressively — it’s that noncurrent loan balances are growing faster than banks are building the allowance.
Community banks are feeling this more acutely: the reserve coverage ratio at community banks declined from 163.5% in Q2 2025 to 157.1% in Q3 2025 as the allowance for credit losses increased at a slower pace than noncurrent loan balances.
Thread 2 — Provision expense: persistently elevated but plateauing
The industry’s provision expense was $22.3 billion in Q4 2024, and provision expense has been higher than the pre-pandemic average for the past ten consecutive quarters.
In Q1 2025, provision expense was $22.5 billion — a modest increase of just $66.5 million from Q4 2024 — and the industry continued to build reserves, as provision expense exceeded net charge-offs by $1.2 billion for the quarter.
Quarterly provisions for loan losses and loan loss reserves were up 9.1% year-over-year even while loan growth was tepid at just 3%, signaling that banks are reserving defensively relative to their book growth.
Thread 3 — CRE-specific stress: large banks hit hardest in absolute terms, but better capitalized
Banks with greater than $250 billion in assets reported a non-owner-occupied CRE past-due and non-accrual rate of 4.33% in Q2 2025, down from the recent peak of 4.99% in Q3 2024 but well above the pre-pandemic average of 0.59%. However, these banks have lower concentrations of such loans relative to total assets and capital than smaller banks, mitigating overall risk.
Regionals? Not so good.
The macro overlay going into 2026
Trade uncertainties and elevated tariffs could reverse the current trajectory of declining credit-loss provisions, as community banks with concentrated CRE exposure remain particularly vulnerable, with provisions at some institutions already lagging behind rising credit losses.
The declining coverage ratio despite elevated provisions is a late-cycle signal — it means the denominator (stressed loans) is outrunning the numerator (reserves).
This dynamic concentrates at Regionals because they appear structurally central in networks precisely because they carry disproportionate CRE exposure relative to capital.
The Fed?
In our petrodollar monetary system, inflation follows oil prices.
Oil prices increased more than 40% in March 2026 before breaking out over $115.
Now faced with the Hormuz shock, the Fed is stuck in a delicate position: the FOMC voted 11-1 to hold rates at 3.5%–3.75% at the March 2026 meeting, balancing expectations of a pickup in inflation from higher energy prices against a soft but stable labor market.
We’ll next dive into the Boston regional cohort.
Stay tuned.
