The note answers two market questions:
- How does one detect a structural break in global oil markets subjected to geopolitical shocks (e.g., the Iran War)?
- When did the Iran War signal a regime change in global oil markets?
Signal Detection
The Bai-Perron (2003) procedure endogenously detects multiple, unknown structural breaks in time series data. It flags regime breaks by identifying when parameters in a linear model change over time, providing consistent estimates of break dates, even with heterogeneous errors.
Bai-Perron can be implemented in Python using the ruptures library, which offers off-line change point detection in the analysis and segmentation of non-stationary signals (C. Truong et al. (2020)).
Implemented algorithms include exact and approximate detection for various parametric and non-parametric models. ruptures focuses on ease of use by providing a well-documented and consistent interface. In addition, thanks to its modular structure, different algorithms and models can be connected and extended within this package.
The global nature of oil markets presents a range of possible time series signals to be considered:
- WTI (West Texas Intermediate)
- Very liquid US oil benchmark
- Not directly exposed to Iran War risk
- WTI has a history of decoupling from Middle East stress due to shale supply dynamics in the US.
- Brent
- Global seaborne benchmark with North Sea delivery
- Captures the Europe/Asia demand dynamics and offers a better proxy for global supply disruption over WTI.
- JCC (Japan Crude Cocktail)
- Weighted average of crude imported into Japan
- Dominated by Middle East sour grades
- Published monthly reducing the timeliness of the signal.
- Dubai/Oman
- Physical Middle East benchmark sour crude.
- Most directly exposed to Hormuz risk
- However, Dubai/Oman is less liquid and is more difficult to access using public data (e.g., FRED api).
In considering the daily geopolitical risk of impending war strikes, we focused on 2 oil benchmarks available through FRED api:
- Brent: global price signal
- Brent-WTI spread: geopolitical premium signal isolating market demand fluctations. A sustained widening of Brent-WTI spread flags seaborne supply risk.
We considered three other signals:
- VIX: financial system fear
- 5-year breakeven inflation: the commodity pass-through to inflation expectations.
- WTI Crude Volatility (OVX): the VIX equivalent for oil
Observations
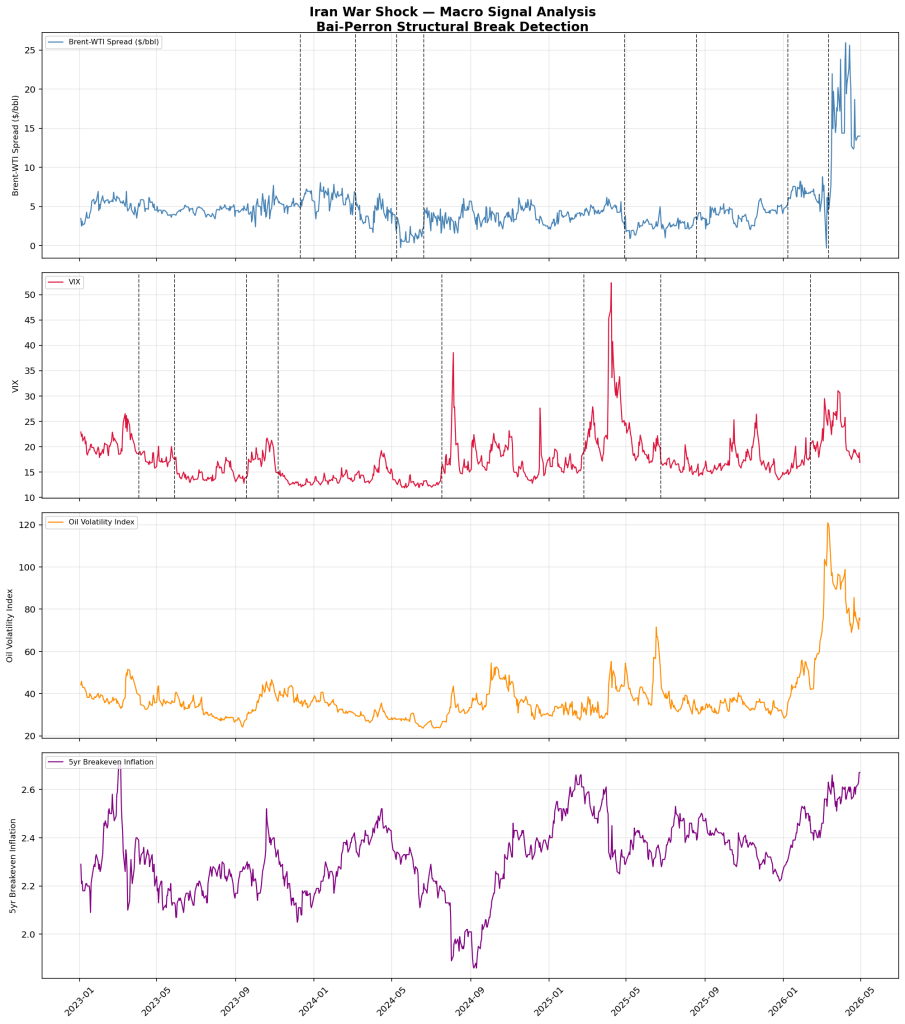
We examined the period January 3, 2023 – April 30, 2026 comprising 860 observations. This period encompasses the current hostilities, the 2025 war strikes, and the Tariff shock.
The Bai-Perron algorithm flagged breaks in the time series data.
| Window | Brent-WTI | VIX | Gap (days) | Notes |
| Apr-Jun 2025 | 2025-04-29 | 2025-06-24 | ~56 | Tariff Shock |
| Aug 2025 | 2025-08-29 | – | – | No VIX |
| Jan-Feb 2026 | 2026-01-08 | 2026-02-12 | ~35 | Strong |
| Mar 2026 | 2026-03-12 | 2026-02-17 | ~28 | Close |
The Jan-Feb 2026 signal cluster report is consistent with persistent commodity chain effects.
The Brent-WTI spreads presents a dramatic structural brak spiking from ~$5.bbk baseline to $15-25/bbl.
The OVX confirms this spike suustaining coincidental elevation and peaking ~120.
The 2025 breaks appear minor.
We identified the onset of the Iran War Shock regime via the Bai-Perron structural break detection on the Brent-WTI spread, a direct proxy for Hormuz supply risk, with the boundary confirmed by concurrent VIX elevation (2026-02-12).
References
Bai, Jushan; Perron, Pierre (January 2003). “Computation and analysis of multiple structural change models”. Journal of Applied Econometrics. 18 (1): 1–22. doi:10.1002/jae.659. hdl:10.1002/jae.659
Truong, C; L. Oudre, L; Vayatis, N. Selective review of offline change point detection methods. Signal Processing, 167:107299, 2020.
