What can possibly go wrong?
Well, here’s JPM’s John Normand ,head of cross-asset strategy, (courtesy of ZeroHedge): https://www.zerohedge.com/markets/complacency-20-year-highs-jpm-models-warn-imminent-correction
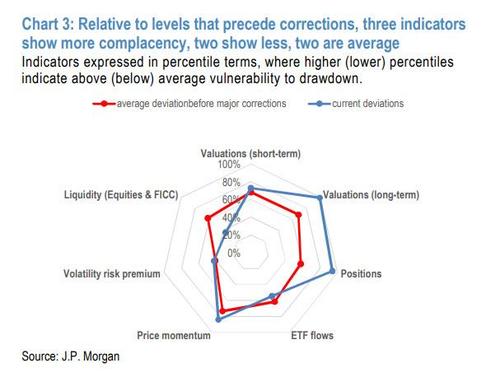
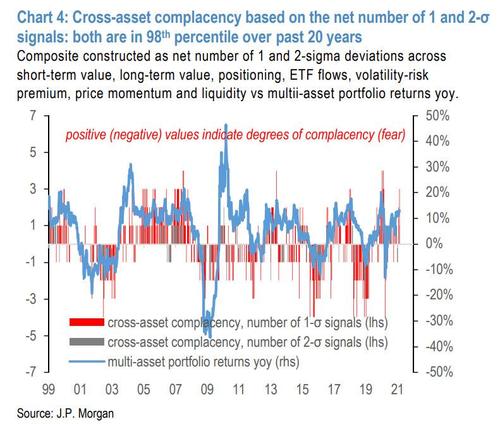
Current readings for individual indicators and the composite are summarized in charts 3 and 4. In Chart 3, four of the seven cross-asset measures have moved beyond the levels that have preceded previous corrections (short and long-term valuation, positioning and price momentum); one indicator is near the average associated with corrections; (volatility risk premia); and two are below typical thresholds (ETF flows and market depth). In Chart 4, aggregate measures of complacency based on the net number of extreme signals has risen to the 98th percentile, based on patterns exhibited over the past 20 years.
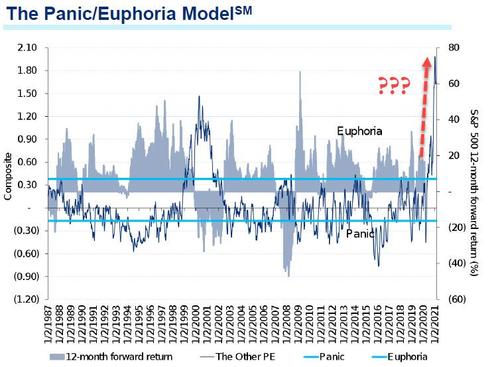
Well, that’s more than 2-sigma outside the band.
Oh, and here are the Charts: