Bankrupt State – Spiking Inflation

History teaches that oligarchies and their statist allies (“public-private partnerships”) suck the life out of a nation and its economy as soon as they get a bite on sufficient power.

Yet, a lot of people support this dynamic – PPPs. Govetnment “investment” in “the future.”

I suspect they hope to get a taste for themselves – trickle down oligarchy.

Call it Stockholm Syndrone. Or, maybe it’s just trying the Roman playbook for building an empire – the conquered quickly become allies to extend the plunder.

Works until you out of tribes to conquer. Or you extend yourself to the point where you are outnumbered by tribal alliances not up for a “hostile takeover.”

After the Sock Puppet Administration was installed last year, the Greater Oligarchy running the US announced policies aimed at buying real votes to supplement the fake ones ranfomly flipped in the Dominion Voting Systems computers, err, “vote counting” machines.

The Roman playbook again: bread and circus.

As the poet Juvenal wisely observed:

“[Populus] qui dabat olim imperium, fasces, legiones, omnia, nunc se continet atque duas tantum res anxius optat, panem et circenses.”

“[The people] which formerly gave military power, high offices, legions, all, now contains itself, and eagerly desires two things only—bread and circus games.”

For more on how Rome gutted its currency (like today’s Federal Reserve/Uniparty Congress) check out Jeff Desjardins here: http://money.visualcapitalist.com/currency-and-the-collapse-of-the-roman-empire/)

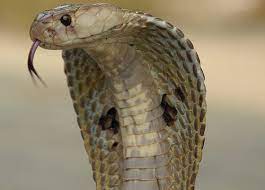
Didn’t take long for the inevitable upshot to become reality – barely a hundred days for “cobras” to rear their nasty heads. Which only says we were THAT close to the edge after the most recent 20 years of the Uniparty Congress.

Here’s Larry McDonald of Bear Traps Report, courtesy of Zero Hedge: https://www.zerohedge.com/markets/we-are-early-stage-biggest-cobra-effect-history-economics

We Are At The Early Stage Of The Biggest Cobra Effect In The History Of Economics

“We believe we are at the early stage of the biggest Cobra Effect in the history of economics. As the massive monetary and massive fiscal stimuli (over $15T globally) conjoin to save the economy from a deflationary depression, instead they risk hyperinflation – overweight commodities.”

Vaccination parties have broken out on many street corners as explosive human energy has come roaring out of the cage. To us, this is a preview of what is about to transpire around the planet and the “Cobra Effect” has entered the 4th inning. When governments tinker in capital markets there are always unintended consequences. Above all, we must keep in mind – what transpired in Q1 to Q4 2020 was NOT a mere tinkering.

We have just lived through a colossal public-private experiment where fiscal and monetary policy globally have been unleashed at unprecedented proportions. It is easy to sit back and think the 2021-2022 recovery will be much like the 2009-2010 vintage. This is a mistake.

A year ago when we laid out our high conviction reflation trade, inflation engines were limited to some supply chain disruptions. Today, we are looking at multiple inflation furnaces cooking away as we speak.

First, Uncle Sam has dramatically altered the employment picture with the private sector going toe to toe with Mr. Stimmy. Breaking news, when you pay human beings NOT to work it is very hard to get them back into the labor force. Friday’s employment cost index (ECI) print is simply an appetizer, with the main course shock coming to CPI (average hourly earnings) data in the months ahead.

“That ECI number is solid big” – CIO NY Based Hedge Fund. ECI spike was driven by a 1.0% jump in wages and salaries. If this is repeated over the next three quarters, the y/y rate will reach 4.1% by Q4. The Fed does not look like it will have an easy summer communicating its approach to markets. ECI wages and salaries, which follow positions (less compositional skew) jumped 4.0% SAAR in Q1. Core PCE inflation rose 0.4% MoM, +2.6% SAAR over the last three months. Why work when u have stimmy, Uncle Sam is forcing wages higher.

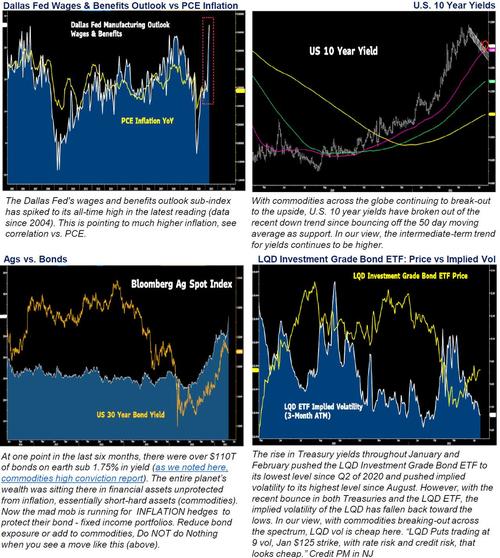
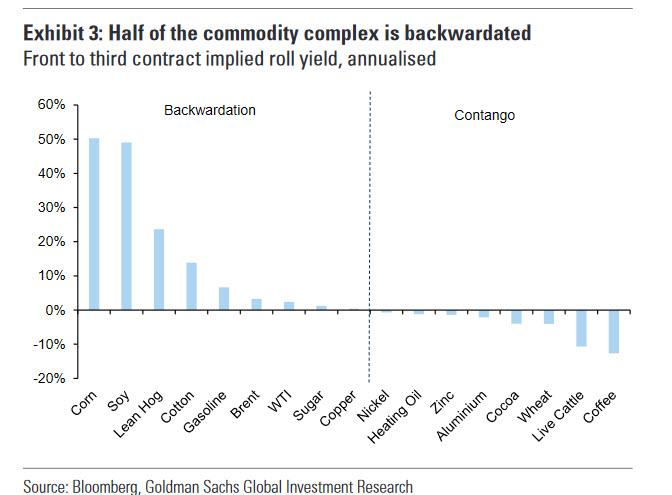
“The premium for commodities that can be delivered now versus later into the future is the highest it has been since at least 2007, signaling just how strong the world’s demand is for raw materials and how tight supplies are.” – Family Office CIO

Keep in mind, it was hot AHE data that triggered the February 2018 thirteen percent drawdown in the Nasdaq 100 and knocked the XIV Short Volatility ETF into retirement.

Today, we are looking at a whole new serpent, a far different beast. ESG inflation side effects are oozing through the commodity market (oil, gas, copper), and the agricultural inflation engine has rarely been stronger.

Real GDP in 2Q is on pace to print 12% q/q annualized rate -nearly double 1Q’s performance –with weekly tax data, weekly rail traffic, and monthly regional manufacturing indices are all surging, inflation risk highest in a decade.

For S&P 500 companies, the uncertainty factor on forward-looking profit margins has just moved from blue-sky to dark grey, in terms of true visibility.

Up until now, all the inflation-reflation forces we have witnessed have been supply-driven. As vaccinations reach critical broad distribution targets. We have yet to see real, vaccine-fired demand-induced inflation.

Risk:There’s a high probability this is it for the tech and the Nasdaq. Supply chains are a mess (disruption unquantifiable), labor shortages exploding as Uncle Sam is the private sector’s colossal drag, commodity inflation is entering a new phase, margin pressures across the SPX are developing exponentially. The Fed is digging in dovish heels which will just make all of the above-unintended consequences that much worse. It’s very similar to Q4 2018, tough guy Powell is playing a dangerous game. We remain short the NDX, long commodities (XLE, XME, etc).

“Despite printing more than $80bn in revenue, +50% YoY, the FAAMNG companies really have not moved YTD. Arguably, these big Tech companies are the world’s best businesses and are failing to catch a meaningful, sustained bid.”  – JPM

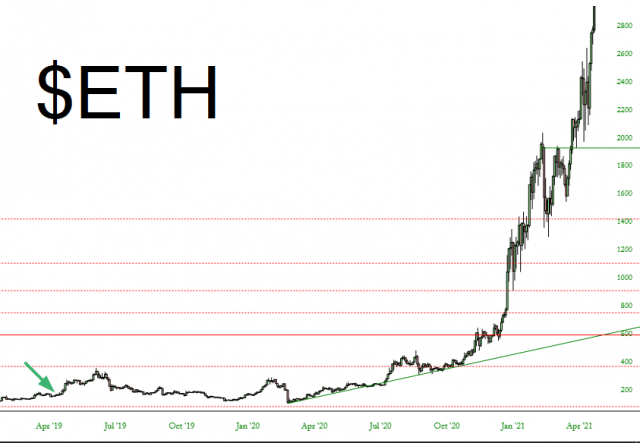
Tech stocks will get destroyed as we move to the next act of this inflation beast.

Comment: Larry often makes a good case as he did above in ZH. Makes me want to add my own two-cents.

First, if you haven’t done so already, click the “Cobra Effect ” link Larry inserted early in his piece. It points to an article in Psychology Today explaining the Cobra Effect – the unintended consequences of simple-minded policies.

Don’t worry – it’s “business-safe.”

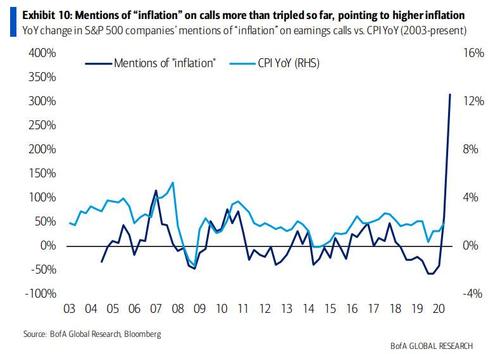
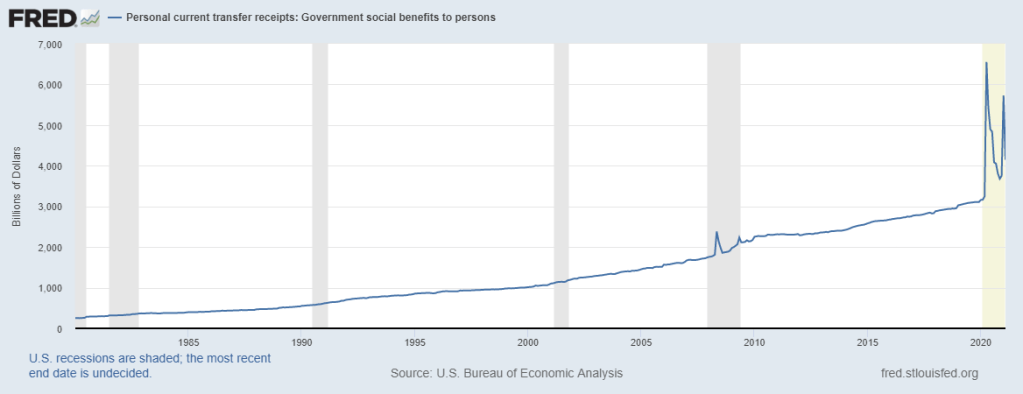
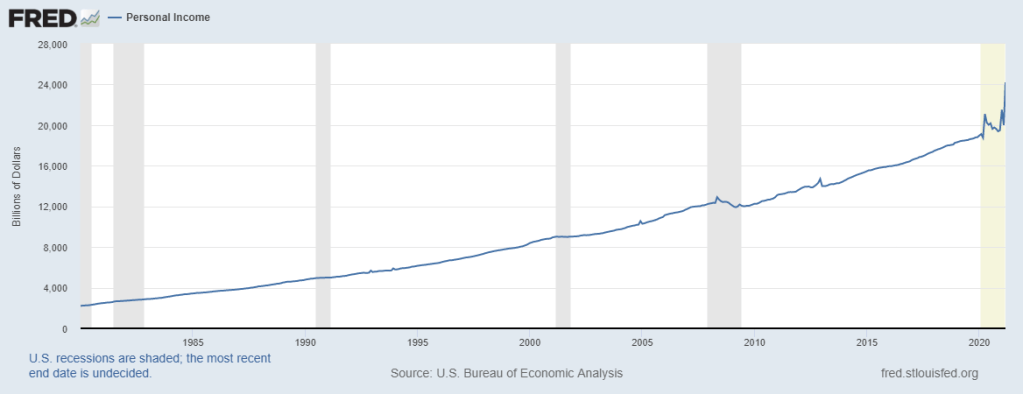
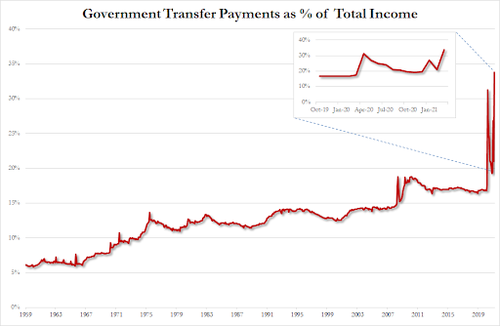
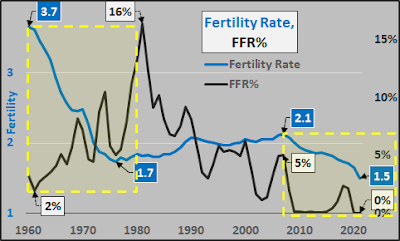
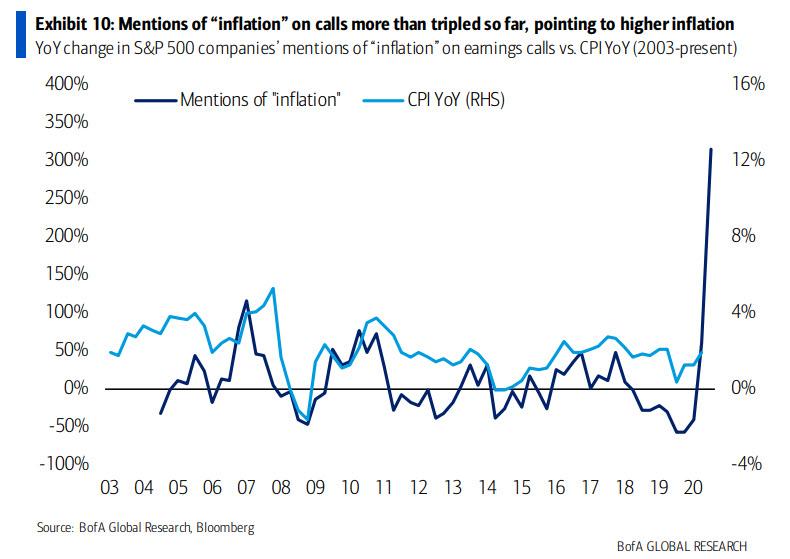
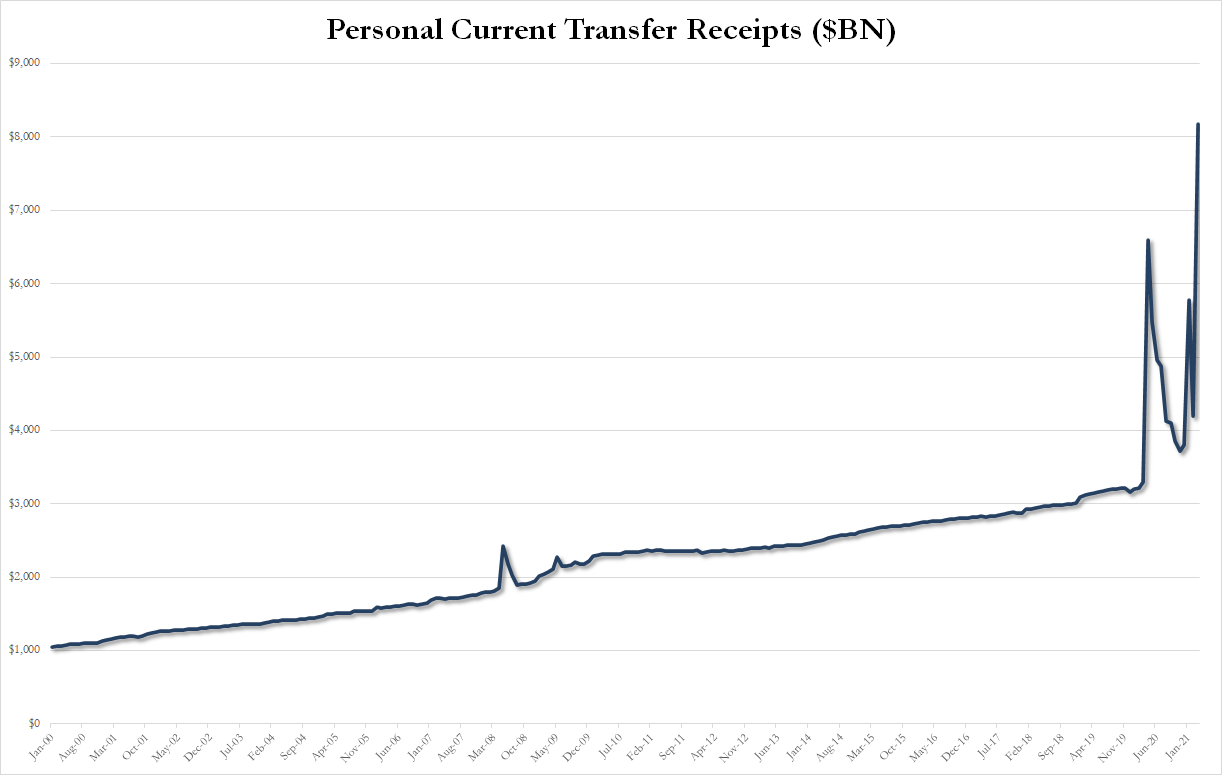
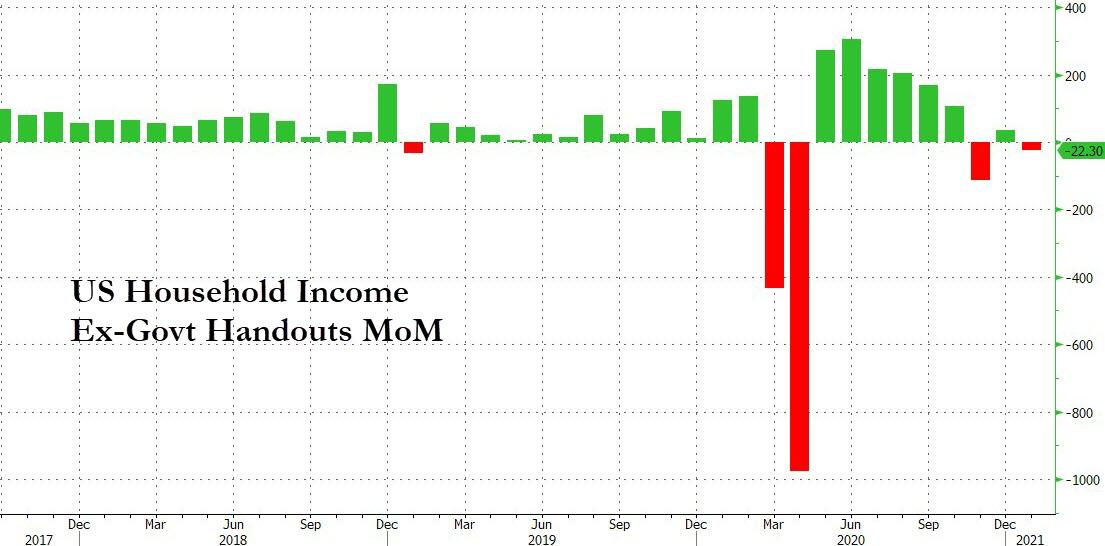
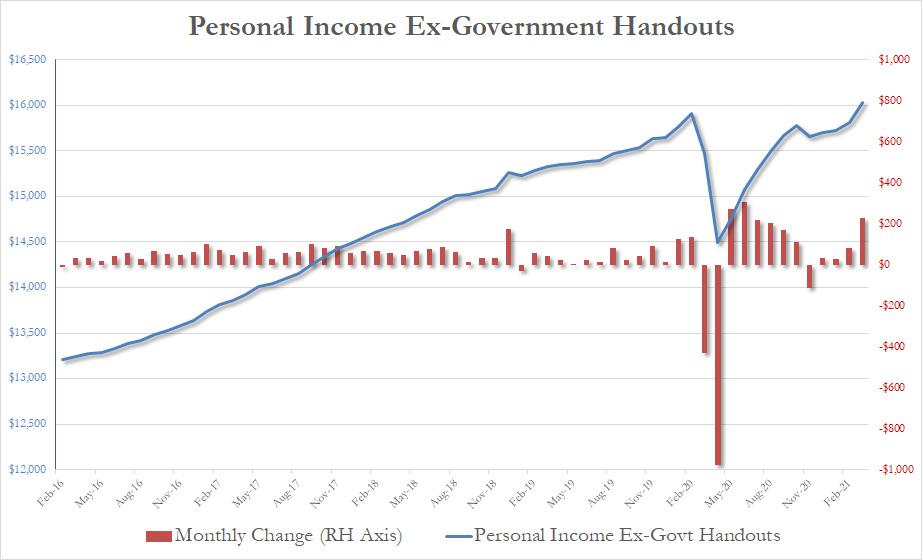
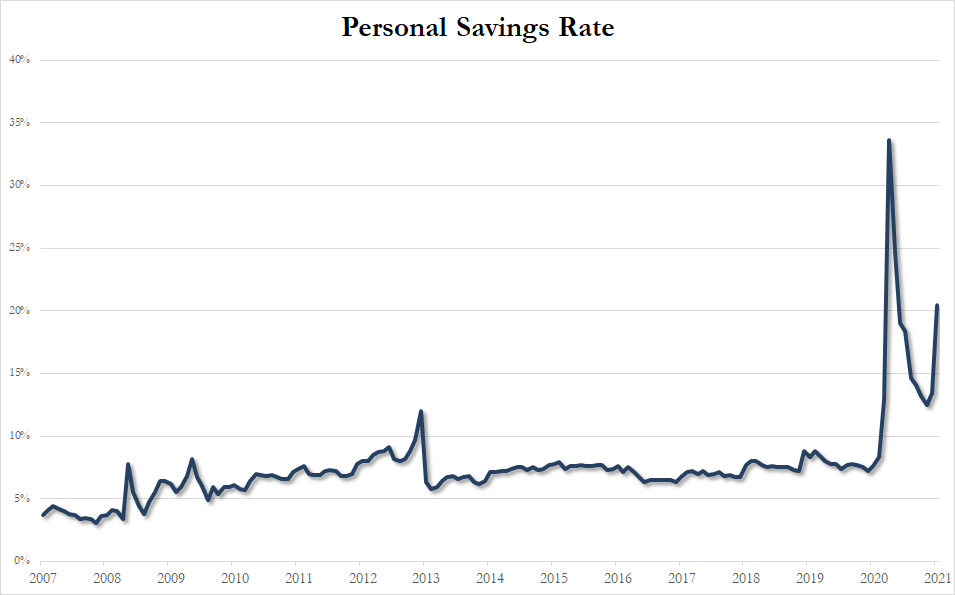
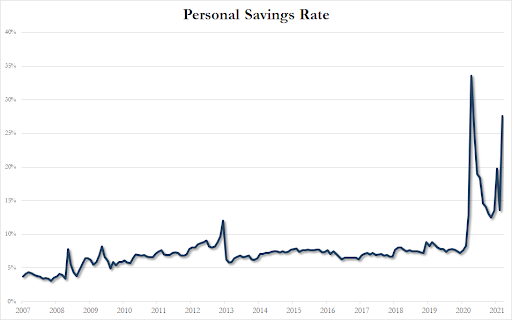
Speaking of cobras, what does this graph say about what’s going on?

Alex – Gone So Soon?

Some might call this Alex-pic a mugshot.

After all, she’s with Paul Weiss et al. and represents the mega-banks, natural allies of the Democrat Party. Paul Weiss also doubles as the “muscle” for said Democrat Party.

And Alex has predigree progressive creds: J.D., Yale Law School (1993), B.A., Williams College (1990) for starters – that gets you into the club.

In the neighorhood I grew up, we called that getting “made”. Makes a soldato bullet-proof (unless Crazy Joey Gallo is around – no one was safe then).

Criminal lawyer is a bit redundant, don’t you think? Is it CRIMINAL lawyer? Or criminal LAWYER? Hard to tell the difference whether it’s street or white crime.

A “bullet-proof” crim partner in the Paul Weiss Litigation Department, co-chair of the FCPA practice group, and had “extensive white collar criminal and regulatory investigations practice focusing on the Foreign Corrupt Practices Act, as well as on securities and accounting fraud issues”.

Translation – she’s the “get outta-jail-free” card for “criminal woke” clients everywhere. Or was that phrase redundant?

Moreover, Alex is also a hypersonic missile orbiting in a holding pattetn, waiting for a target.

She could be a character straight out of Billions – “Chuck Rhoades” effortlessly floating back and forth between the Praetorian Guard/Комитет государственной безопасности (КГБ/KGB/DOJ) and a Fortune 100 “BlackOps” lawfare team relentlessly chasing it’s target (yeah, I’m still faithfully awaiting the return of “Bobby Axe”.) A terminator.

Anyway, let the “Martens” of Wall Street On Parade do their thing: https://wallstreetonparade.com/2021/04/alex-oh-the-strange-case-of-the-sec-enforcement-chief-who-beat-a-hasty-exit-after-six-days-on-the-job/

Alex Oh: The Strange Case of the SEC Enforcement Chief Who Beat a Hasty Exit After Six Days on the Job

Less than seven hours after Wall Street On Parade ran our negative critique on SEC Chairman Gary Gensler’s pick to be the top crime fighter at his agency, Alex Young K. Oh abruptly resigned that position after just six days on the job.

Corporate media is now attempting to blame the sudden exodus of the 20-year veteran of the law firm Paul, Weiss, Rifkind, Wharton & Garrison (one of the go-to law firms for the mega Wall Street banks) over her and/or her Paul Weiss colleagues saying something rude in a deposition where they were defense counsel for Exxon Mobil. (If you’ve ever sat for a deposition represented by Big Law on both sides, you know that rudeness is often de rigueur.)

Comment: having been both expert witness and deposition consultant for more than a few “Big Law” firms for more than a few years in the past, The Martens nailed it on that whole “rudeness-thing” in Big Law.

Certainly in everyday in-house meetings, lawyers eat their young and anything else in range, too. But “nailed it” goes into overdrive when opposing counsel is involved.

In one case, it got so funny (at least to me) that the transcript even records where Defendant’s counsel instructed Plaintiff’s counsel (my beloved client) to tell me to stop laughing as she laid into him. It was priceless entertainment. Actually, the Deposed and I were both laughing. Sometimes, I miss those days – such fun.

E – if you are reading this, I know you recall that deposition. Memorable kick-ass performance. I get a tear in my eyecas I reflect on that day.

Anyway, back to the Martens.

According to reporting at Politico, lawyers for plaintiffs in the case told the court that the Paul Weiss lawyers “had characterized them as ‘agitated, disrespectful and unhinged.’ ” After four years of the highest officer in the land, President Donald Trump, Tweeting every manner of insult against elected officials and foreign dignitaries, that actually sounds rather tame to us.

Comment: ‘agitated, disrespectful and unhinged’? I, for one, am shocked. SHOCKED!

Come on, they’re lawyers, predatory rent-seeking – it’s what they do. They were trying to make partner (or senior partner).

And as for the last elected President before the selected Sock Puppet (maybe “last President ever actually ELECTED in this country”) treating elected officials and foreign digs like they were in the completely corrupt commercial real estate business, I found that tendency reason enough to vote for him.

Unlike Democrats, I only vote once per election. Unlike a lot of Democrat voters, I’m a living US citizen and my name is my own.

Anyway, back to live action.

We can assure you, without hesitation, that something far more insidious is going on here.

Paul Weiss represents the most powerful mega banks on Wall Street. And yet, this law partner with more than two decades at the firm and a Yale law degree was representing petty drug dealers and bank robbers in the U.S. District Court for the District of Columbia according to federal court records.

We decided to take a look at cases in which Oh served as an attorney in the U.S. District Court for the Southern District of New York, since that is where most cases involving the serial crimes on Wall Street are conducted.

Looking at both open and closed cases dating back to 1997, we found 187 cases where Alex Oh had served as an attorney in the District Court for the Southern District of New York. Numerous cases involved securities fraud and occurred when Oh was an assistant U.S. Attorney for the Justice Department in that region. Oh served in that capacity for three and one-half years, from January 1997 to June 2000, according to her LinkedIn profile.

But here is where things get curious. The court records show that Oh was to receive notifications from the court not at the U.S. Attorney’s office, but as follows:

Alex Young Kyong Oh
Paul, Weiss, Rifkind, Wharton & Garrison, LLP (DC)
2001 K Street, N.W.
Washington, DC 20006
(202) 223-7334
Fax: (202) 223-7474
Email: aoh@paulweiss.com

We thought perhaps the Court updates the addresses of attorneys after the cases are closed. We checked for other former U.S. Attorneys in the Southern District of New York who are now with Big Law firms. Their court records showed them employed at the U.S. Attorney’s office when they were supposed to be employed there.

This raises the question as to whether Alex Oh was simply “loaned” to the U.S. Attorney’s office by Paul Weiss. If that sounds strange to you, consider that in February, long-tenured Paul Weiss law partner, Mark Pomerantz, took a leave to assist Manhattan District Attorney, Cy Vance, in his investigation into the finances of Donald Trump. The New York Times reported that Pomerantz had been “helping” Vance’s office “informally for months,” before taking a leave from Paul Weiss and joining Vance’s office. (See Editor’s update below.)

Deutsche Bank was one of Trump’s largest bank lenders over the years — even after other banks refused to lend to him. Deutsche Bank is also a longstanding client of Paul Weiss.

Comment: well, that sounds like Deutsche Bank – dispatching a terminator into the DA’s office to get a mutual enemy.

Did I say mega-banks in commercial real estate business are corrupt? Oh, right, yeah, I did that already.

Sorry for the interruption – now back to the program already in progress.

Dennis Kelleher, President of the nonprofit watchdog, Better Markets, issued the following statement in response to Oh’s resignation:

“The SEC has failed the American people by repeatedly selecting Wall Street defense lawyers as Directors of Enforcement. They come to the SEC with needless and unhelpful baggage, including crippling conflicts of interest regarding current and past clients as well as a mindset and milieu ill-suited to being an aggressive enforcer of the law against those past private sector clients. Regrettably, those past clients, who often get sweetheart deals from the SEC, are almost always also future clients when those former defense lawyers go through the revolving door upon leaving the SEC, as has happened with all the recent Enforcement Directors and even the most recent past two SEC Chairs…

“Today’s resignation of the SEC Director of Enforcement, who spent more than 20 years as a Wall Street defense lawyer and only a little more than three years as a prosecutor in the last millennium, should be viewed as an opportunity for the agency to select someone more appropriately qualified for the job, one with deep and broad experience in protecting the public interest without fear or favor. There are lots of highly qualified federal and state prosecutors, state securities regulators, and many others, including among the outstanding career professionals at the SEC itself, who would excel in that job.

“That’s what the American people deserve, not yet another Wall Street defense lawyer with years, if not decades, of excusing and defending private sector clients accused of breaking the law, often repeatedly and egregiously. Now is the time to break with that disreputable pattern of hiring the wrong people hoping they will do the right job the American people need done.”

We say Amen to that.

Editor’s Update: The Press Office for the U.S. District Court for the Southern District of New York has informed us this morning that attorneys are allowed to update their contact information, which then is applied universally, even to old, closed cases. We have also reached out to the U.S. Attorney’s Office for the Southern District of New York for further clarification.

Priceless.

And, more to come on this one. Blood in the water.

But Dennis misses the point. Praetorian Guards (and Sock Puppets) serve state interests which are the interests of the oligarchy. KGB served politburo interests.

Paul Weiss floats between their clients and the state.

That’s what Big Law does relentlessly.

They say sharks don’t sleep.

Banana Republic – Literally

The Personal Current Transfer Receipts (PCTR) report summarizes government social benefits and net current transfer receipts from business (unemployment).

Simply put, it’s government welfare. And that welfare is behind the record surge in personal income in March when China Joe, the Sock Puppet “president,” distributed $1.9 trillion in “stimulus checks”.

March PCTR payments ballooned to a mind-blowing $8.1 trillion annualized. That was more than double the Sock Puppet’s $4.1 trillion payout in February, and $5 trillion above the pre-Covid trend of ~$3.2 trillion.

When you back out the PCTS, personal income remains unchanged from a year ago.

So much for China Joe’s claims of “restoring the American economy”.

In longer-term context, one can see the creeping impact of government payments, shown in red below.

Now, check out the savings rate.

Yikes!

You know where a lot of the dough is going – besides “China Inc.” imports sitting at anchor of Long Beach). GME anyone?

The bottom line – government (cough – other people’s money – cough) is now responsible for 33.8% of total income – and rising fast.

Don’t think the Oligarchs are paying this welfare. With Federal Reserve inflation and ever-rising debt (Federal and private), the middle class is paying for the Sock Puppet’s give-away.

As the Oligarchy pockets their taste from debt and China, the State has driven down America’s share middle-income households.

We’re now a “banana republic like Turkey, China, and Russia. 

In fact, most countries have a larger middle class than the US.

35 years of Federal Reserve policies got you there.

First Real Estate, Then Oil, Next is Food

The quantity of USDs in circulation has been growing at an accelerating rate since the JFK/LBJ Guns and Butter program. The bill came due when Nixon came along. One option was to cut spending and raise taxes to pay off the debt. Nixon took the other option and closed the gold window giving rise to the PetroDollar.

And so, inflation (the M2 stock) doubled in ~10 years.

Doubling slowed from the Reagan years but continued into the 1990s under Greenspan’s policyes – only slowed when the Republican Congress balanced the Federal Budget.

The Congress under Bush 2.0 and Obama took the M2 from ~$5 trillion (2000) to ~$12 trillion (2016). That’s a 140% raise in 16 years.

Congress under Trump took the M2 from $12 trillion to $18 trillion. Call that ~50% in 4 years on par with the JFK/LBJ spending program.

Congress under the Sock Puppet is already adding debt (and the M2) at the rate of over $2 trillion per year. And between his “COVID relief” legislation, his “infrastructure” plan, and his family plan, thr corrupt Sock Puppet has called for $6 trillion in new federal spending within the first 100 days of his presidency.

Over the last 50 years, the M2 is up ~20X

While the US population is up 2.5.

Any surprise the cost of housing is as high as it is? And accelerating?

Chris Kimble sees oil as the next to spike: https://www.seeitmarket.com/perhaps-inflationistas-should-be-watching-crude-oil/

Perhaps Inflationistas Should Be Watching Crude Oil?

inflation correlation to crude oil prices commodities chart image april 28

Commodities prices have risen rather sharply over the past 12-18 months, adding to worries of pricing pressure and inflation.

As you can see in the chart above, businesses are taking note. The word “inflation” is being mentioned at a record rate by S&P 500 companies on earnings calls.

Although there are several inputs that effect consumer prices and inflation, perhaps one major indicator is worth watching right now: Crude Oil.

How crude oil trades directly effects energy prices… and those prices are major inputs for both consumers and businesses. And right now crude oil is trading at an incredibly important “long-term” resistance level.

Since peaking in 2008, crude oil has been trading within a declining price channel (marked by lower highs on the “monthly” chart above). But the past several months have seen crude oil (along with other commodities) surge in price. And this now has oil trading at dual price resistance, marked by its prior two highs as well as the falling downtrend line. While a move lower may keep inflation in check, a breakout move higher would embolden inflationistas and bring worries of higher prices to the fore.

Humbly speaking, I think what crude oil does at (1) will determine if inflation is going to become an issue in the months ahead. Stay tuned!

If the Sock Puppet gets its way with its Climate Action Plan, you can count on high energy costs.

Which means high food costs as well.

Suppressing Interest Rates and Life

I was fortune to study economics under Murray Rothbard. Quite an experience.

Then again, so was studying philosophy under Leonard Peikoff. Also quite an experience.

And, serving as a commissioned officer in the US Navy under Admiral Hyman G. Rickover. THAT was an experience.

These three guys had a lot in common. I got smacked around along the way. But recall the etymology for the modern English word – discipline. It originates as “disciplus” which later became “disciplina” meaning instruction or knowledge. Middle English has “discipline” to mean “scourge yourself”.

Online etymology (https://www.etymonline.com/search?q=discipline):

c. 1200, “penitential chastisement; punishment for the sake of correction,” from Old French descepline “discipline, physical punishment; teaching; suffering; martyrdom” (11c., Modern French discipline) and directly from Latin disciplina “instruction given, teaching, learning, knowledge,” also “object of instruction, knowledge, science, military discipline,” from discipulus “pupil, student, follower”

It was all of that with Rothbard, Peikoff, and Rickover.

Back to Murray.

Rothbard long ago observed that manipulating capital markets introduces complex distortions. When the Fed engages in quantitative easing (e.g., purchases Treauries) or lowers interest rates, it increases deposits, bank reserves and credit supply. As credit supply rises, interest rates fall. Similarly, when the Fed raises interest rates (directly or indirectly) credit supply falls, reinforcing the rise in interest rates.

This is the so-called “first order effect”. But such effects signal the market long-term credit supply trends. An expanding money supply subisidizes debt and destroys creditor wealth. Deals previously priced at higher interest rates now tend to go underwater. A profitable loan written at 5% can now be unprofitable. Debtors enjoy the subsidy. The longer the Fed misprices credit, the longer the inflation expectation.

What’s interesting is that which follows in society. What follows depends on who you are.

If you work and save, the Fed is your enemy. If you consume and leverage, the Fed will take care of you.

In a recent post in Ecnomica, Chris Hamilton presents some interesting data and correlations – check him out here: https://econimica.blogspot.com/2021/04/federal-reserve-induced-inflation-has.html.

Or read Chris here:

Federal Reserve Induced Inflation Has Resulted in Collapsed US Births…Twice

Total US births are collapsing and likely to continue falling significantly further over the coming decade(s). However, this isn’t our first rodeo…as total births collapsed during the 1960’s ’til early ’80’s…almost inexplicably against a fast growing childbearing population. And now, since 2007 (and not just a C-virus one off), total births have again collapsed against a growing childbearing population. I will make the case that much of this comes back to the Federal Reserve’s policies to foment stagflation/inflation which have created the birth dearth(s). Young adults (potential parents), like the canary in the coalmine, are among the most economically vulnerable to the Fed fueled asset inflation (with lagging pay increases and little to no assets riding the bubble, at least partially offsetting the rising costs of living). Their determination to delay marriage and children is the ultimate barometer of the US economic wellbeing.

The chart below (1950 through 2040) shows annual US births (blue columns…regardless parents legal/illegal status plus Census ’00/’08 birth projections through 2040), actual births (blue dashed line…including my projection from 2020 through 2040), 20 to 35 year old female childbearing population (pink line…representing roughly 80% of births among 15 to 45 year old total female childbearing population), and soaring 45+ year old post-childbearing female population (yellow line).

Looking at the US childbearing female population, there is no growth anticipated through 2040, while fertility rates continue tanking due to a slew of economic / pandemic / environmental / overpopulation concerns. The Census continued projections for rising fertility rates and total births is poorly founded.

Viewing the year-over-year change in 20 to 35 year-old childbearing females (pink columns), annual births (dashed blue line), and Federal Reserve set Fed Funds rate % (black line). We are looking at two periods of collapsed births in the US since 1950…both in conjunction with significantly increasing female childbearing populations (which of and by itself, should have resulted in flat to rising births). Instead, upon the initiation and continuation of major stagflationary/inflationary interest rate policy changes, fertility rates and total births fell precipitously. 

Below, take a gander at US fertility rate (children per females) vs. Federal Funds Rate %. While other segments of the population fared far better thanks to offsetting asset inflation, young adults were not so lucky and chose to delay/refrain from marriage, family formation, and having children.

The age of first marriage for both males and females has soared by almost a decade (chart below), while the 30 year’ish window of fertility has not really changed. Females of most species can give birth during 80%+/- of their lifespans. Our species is capable of childbearing during only about 40% of the lifespan (females typically reach menopause by age 50). At age 30, 75% will be pregnant within one year of attempting to do so. By age 40, the odds drop to 40%. Also, risks of adverse outcomes for the child/mother rise dramatically as the mothers age increases. At age 20, 1 in 1,441 births will result in Down Syndrome…by age 45, 1 in 32. Simply put, women are more fertile and births are less challenging on mother and child while women are in their prime childbearing years from 20 to 30…but the current economic system simply doesn’t support this option.

Due to economic / financial pressure, dual-income households have become the norm. The percentage of childbearing age females in the labor force now is nearly double the post WWII situation. Since 2000, females have fluctuated between 65% to 70% labor force participation…well above the 40% seen in 1960 (white line below is raw female 15 to 54 year old employed / population ratio).

In order to achieve financial strength / independence, the number of women getting secondary educations has soared. As of 2019, a greater percentage of females (36.6%) have four-year or greater college degrees than males (35.4%)…compare that to the pre-war situation of 1940, with 3.8% & 5.5%, respectively. Obviously, the 4+ years of education plus the associated soaring student loan debt has pushed marriage, homeownership, and children to the latest on record.The average age that a female first marries has soared from 20 in the 1950’s to somewhere beyond 28 years old in 2021.

Consider…-The average age of a mother at first childbirth is now over 26 years old-The average age of a married mother at first childbirth is now over 29 years old…versus unmarried mothers closer to 24.-Women with a college education (heavily impacting financial capability of supporting a family) are now approaching 31 years of age before first childbirth versus 24 w/out a college degree.

It’s also important to note that the decline in births is not due to abortion. Total abortions and abortions to live-birth ratio continue to decline from the 1980’s, early 90’s peak. Total abortions are down 50% since peak, and abortion to live-birth ratio is at record low levels since Roe v. Wade in 1973. Still, as of 2018, abortion to live-birth ratio was 189 abortions per 1000 live births…still significant (& massively contentious), but my point is it is a decelerating impact on total births.

Below are the Census projections for births, going back to ’00, ’08, ’12, ’14, and 2017. As can be seen, births continue to massively undershoot the Census projections. Much of the miss can be attributed to bad assumptions regarding Latino immigration rates and fertility rates…which have both been far lower than projected by the Census. The Latino population has normalized to the much lower fertility rates and economic situation than the Census could conceive.

From 2009 through 2020, there were 6.6 million fewer births (-12.5%) in the US (regardless legal/illegal status of the parents) than the Census projected there would be, in both it’s 2000 and 2008 projections. Given the flat childbearing female population, soaring average age at first marriage, and collapsing fertility rates, I’m projecting nearly 15 million fewer births (-30%) over the next decade than the ’00/’08 Census projections.

So What? Ultimately, the most inflationary thing in an economy is population growth and family formation. But the Fed’s policies, although advocating inflation via substituting currency dilution, interest rate mismanagement, quantitative easing, etc., is actually the basis of long term deflation. The merits of a financial system requiring infinite growth against an economic system meant to supply the finite needs of a population (with little to no population growth) should have been debated long ago. Now the economic system is being poked and prodded with stimulus, ZIRP, QE, untold leverage, etc. to synthetically produce growth for a financial system that can be called nothing more than a Ponzi scheme. The faster the substitution of these synthetic proxies (and their asset inflation impacts), the faster the decline in births will be. All of the trends in place to push births lower are accelerating. Whether this is intentional or de facto, I can’t say…but the outcome of collapsing US (and worldwide) births is clear.

Less Global Warming Than IPCC Forecasts

“Science is real”.

Hear that a lot, don’t you? Usually from people who aren’t scientists, never studied science in college or grad school, and probably too a science course in their lives.

If you listen to “St. Greta”, mankind faces an imminent calamity. IPCC models forecast rapidly rising temperatures.

But as the graph above demonstrates, the lastest IPCC model (CMIP6) is still running hotter than actual temperatures. Just like CMIP5 and CMIP4. And all IPCC models of the past 2 decades.

Why is that?

Well, likely because the models are not handling cloud albedo well. And, is employing ECS and TCS estimates far hotter than supported by the physics. You can look up ECS and TCS for yourself – if you are reading this post, you are probably interested enough that you should know this stuff. And what albedo means.

The graph above is from Dr. Roy Spencer’s latest post: https://www.drroyspencer.com/2021/04/an-earth-day-reminder-global-warming-is-only-50-of-what-models-predict/

Suggest you read that, too.

Here – I’ll save you a click:

An Earth Day Reminder: “Global Warming” is Only ~50% of What Models Predict

April 22nd, 2021 by Roy W. Spencer, Ph. D.

The claim by the Biden Administration that climate change has placed us in a moment of “profound crisis” ignores the fact that the energy policy changes being promoted are based upon computer model simulations which have produced average warming rates at least DOUBLE those observed in the last 40+ years.

Just about every climate claim made by politicians, and even many vocal scientists, has been either an exaggeration or a lie.

While it is easy for detractors of what I will show to claim I am in the scientific minority (true), or that I am a climate denier (not true; I do not deny some level of human-caused warming), the fact is that the “official” observations in recent decades are in disagreement with the “official” climate models being promoted for the purposes of implementing expensive, economically-damaging, and poverty-worsening energy policies.

Global Ocean Temperatures are Warming at Only ~50% the Rate of Climate Model Projections

Today’s example comes from global-average sea surface temperatures. The oceans provide our best gauge of how fast extra energy is accumulating in the climate system. Since John Christy and I are working on a project that explains global ocean temperatures since the late 1800s with a 1D climate model, I thought I would show you just how the observations are comparing to climate models simulations.

The plot below (Fig. 1) shows the monthly global (60N-60S) average ocean surface temperature variations since 1979 for 68 model simulations from 13 different climate models. The 42 years of observations we now have since 1979 (bold black line) shows that warming is occurring much more slowly than the average climate model says it should have.

Fig. 1. 68 CMIP6 climate model simulations of global average sea surface temperature (relative to the 5 year average, 1979-1983), and compared to observations from the ERSSTv5 dataset.

In terms of the linear temperature trends since 1979, Fig. 2 shows that 2 of the top-cited ocean temperature datasets have warming trends near the bottom of the range of climate model simulations.

Fig. 2. Linear temperature trends, 1979-2020, for the various model and observational datasets in Fig. 1, plus the HadSST3 observational record.

Deep Ocean Warming Could Be Mostly Natural

A related issue is how much the deep oceans are warming. As I have mentioned before, the (inarguable) energy imbalance associated with deep-ocean warming in recent decades is only about 1 part (less than 1 Watt per sq. m) in 300 of the natural energy flows in the climate system.

This is a very tiny energy imbalance in the climate system. We know NONE of the natural energy flows to that level of accuracy.

What that means is that global warming could be mostly natural, and we would not even know it.

I’m not claiming that is the case. I am merely pointing out the level of faith that is involved in the adjustments made to climate models, which necessarily produce warming due to increasing CO2 because those models simply assume that there is no other source of warming.

Yes, more CO2 must produce some warming. But the amount of warming makes all the difference to global energy policies.

Seldom is the public ever informed of these glaring discrepancies between basic science and what politicians and pop-scientists tell us.

Why does it matter?

It matters because there is no Climate Crisis. There is no Climate Emergency.

Yes, irregular warming is occurring. Yes, it is at least partly due to human greenhouse gas emissions. But seldom are the benefits of a somewhat warmer climate system mentioned, or the benefits of more CO2 in the atmosphere (which is required for life on Earth to exist).

But if we waste trillions of dollars (that’s just here in the U.S. — meanwhile, China will always do what is in the best interests of China) then that is trillions of dollars not available for the real necessities of life.

Prosperity will suffer, and for no good reason.

To clear, there is warming. Just not that much.

And more likely from low frequency solar cycle.

Wuhan/CCP/SARS-CoVid 19 Fatality Rate

We know CoVid 19 is contagious.

But how lethal is it compared to an influenza outbreak?

The 2009 swine flu pandemic was an influenza pandemic that lasted about 19 months, from January 2009 to August 2010, and was the most recent flu pandemic involving H1N1 influenza virus (the first being the 1918–1920 Spanish flu pandemic and the second being the 1977 Russian flu). First described in April 2009, the virus appeared to be a new strain of H1N1 that resulted from a previous triple reassortment of bird, swine, and human flu viruses and that further combined with a Eurasian pig flu virus, leading to the term “swine flu“.

Some studies estimated that the actual number of cases including asymptomatic and mild cases could be 700 million to 1.4 billion people—or 11 to 21 percent of the global population of 6.8 billion at the time. The lower value of 700 million is more than the 500 million people estimated to have been infected by the Spanish flu pandemic. However, the Spanish flu infected a much higher proportion of the world population at the time, with the Spanish flu infecting an estimated 500 million people, which was roughly equivalent to a third of the world population at the time of the pandemic.

The number of lab-confirmed deaths reported to the World Health Organization (WHO) is 18,449, though the 2009 H1N1 flu pandemic is estimated to have actually caused about 284,000 (range from 150,000 to 575,000) deaths. A follow-up study done in September 2010 showed that the risk of serious illness resulting from the 2009 H1N1 flu was no higher than that of the yearly seasonal flu. For comparison, the WHO estimates that 250,000 to 500,000 people die of seasonal flu annually.

Unlike most strains of influenza, the Pandemic H1N1/09 virus did not disproportionately infect adults older than 60 years; this was an unusual and characteristic feature of the H1N1 pandemic. Even in the case of previously healthy people, a small percentage develop pneumonia or acute respiratory distress syndrome (ARDS). This manifests itself as increased breathing difficulty and typically occurs three to six days after initial onset of flu symptoms. The pneumonia caused by flu can be either direct viral pneumonia or a secondary bacterial pneumonia. A November 2009 New England Journal of Medicine article recommended that flu patients whose chest X-ray indicates pneumonia receive both antivirals and antibiotics. In particular, it is a warning sign if a child seems to be getting better and then relapses with high fever, as this relapse may be bacterial pneumonia.

Wong et al, 2013 reviewed the literature analyzing the probability of mortality among people classified as H1N1 cases. They found most of the estimates ranged from 5 to 50 deaths per 100,000 cases (0.005-0.05%)) In age-stratified analyses, risk estimates rose monotonically with age, from approximately one death per 100,000 symptomatic cases in children to approximately 1,000 deaths per 100,000 symptomatic cases in the elderly (1%), although with substantial variation in the estimates within each age group.

An external file that holds a picture, illustration, etc.
Object name is nihms518762f4.jpg

Fast-forward to CoVid, Blackburn et al, 2021 also found that the risk for death among infected persons increased with age. Indiana’s IFR for noninstitutionalized persons older than 60 years is just below 2% (1 in 50). In comparison, the ratio is approximately 2.5 times greater than the estimated IFR for seasonal influenza, 0.8% (1 in 125), among those aged 65 years and older (5). Of note, the IFR for non-Whites is more than 3 times that for Whites, despite COVID-19 decedents in that group being 5.6 years younger on average.

References:

Blackburn, J., Yiannoutsos, C. T., Carroll, A. E., Halverson, P. K., & Menachemi, N. (2021). Infection fatality ratios for COVID-19 among noninstitutionalized persons 12 and older: Results of a random-sample prevalence study. Annals of Internal Medicine174(1), 135–136.

Wong, J. Y., Kelly, H., Ip, D. K. M., Wu, J. T., Leung, G. M., & Cowling, B. J. (2013). Case fatality risk of influenza A (H1N1pdm09): a systematic review: A systematic review. Epidemiology (Cambridge, Mass.)24(6), 830–841.

Baltic Dry Index Jumps to Over 10-Year Peak on Capesize Surge

bulk ship

Just as night follows day, so Congressional helicopter money flows right out to sea while Walmart “stuff” comes back in return.

No surprise, the demand for containers and shipping is peaking resulting in spiking shipping rates.

Here’s gCaptain with the details (https://gcaptain.com/baltic-dry-index-jumps-to-over-10-year-peak-on-capesize-surge):

April 21 (Reuters) – The Baltic Exchange’s main sea freight index surged to its highest in over a decade on Wednesday, powered by a jump in the larger capesize vessel segment on increasing iron ore shipments from Brazil.

* The Baltic dry index, which tracks rates for capesize, panamax and supramax vessel ferrying dry bulk commodities, jumped 238 points, or 9.6%, to 2,710, its highest since October 2010.

* The index recorded its biggest daily jump since Feb. 17.

* The capesize index surged 559 points, or 16.2%, to 4,014 – a peak since early October 2020.

* Average daily earnings for capesizes, which typically transport 150,000-tonne cargoes of coal and steel-making ingredient iron ore, jumped $4,638 to $33,290.

* The capesize segment has seen more fixtures reported over the last week, especially due to more demand for iron ore from Brazil, said Rebecca Galanopoulos Jones, head of research at AlibraShipping.

* Real-time shipping data showed an improvement in cargo volumes from the world’s top suppliers. Iron ore shipments by Australia and Brazil recovered last week after two weeks of declines.

* Chinese steel rebar and hot-rolled coil futures closed higher on Wednesday, amid concerns of stricter capacity and output controls in coming months.

* “The new week has set off with strength across both basins for sub-Capes, while capesize is expected to also gain up pace, as the dollar per tonne freight ceiling has risen higher, and a synchronous upwards trend across sizes is possible,” shipbroker Intermodal said in a weekly note on Tuesday.

* The panamax index jumped 133 points, or 5.2%, to a three-week high of 2,690.

* Average daily earnings for panamaxes, which usually carry coal or grain cargoes of about 60,000 tonnes to 70,00 tonnes, climbed $1,196 to $24,206.

* The supramax index advanced 52 points to 1,977.

Reporting by Bharat Govind Gautam in Bengaluru;

Editing by Aditya Soni)

(c) Copyright Thomson Reuters 2021.

Solar Minimum Cold and Snow

The GIF published above presents NOAA’s temperature anomaly forcasts over the next 2 days.

As is evident, we’re looking at lower-48 temperature anomalies of upwards of a dozen degrees C below norms.

I routinely track the effects of the Solar Minimum that has begun and will run at least through 2050 due planetary dynamics reducing solar radiance. This cooling is unwinding the solar warming cycle we’ve seen since ~1840.

To date, the UK has seen the coldest April since 1922. It’s the coldest April in Germany since 1917.

With cold comes a buildup of snow.

Total snow mass for the Northern Hemisphere through April 19, is at an unprecedented 2,400 Gigatons. That’s ~700 Gigatons above the 1982-2012 average.

Next up – spiking agricultural prices.

More on that later.