Last Stand

Holding the line – it’s a phrase that flows through history. Poetic imagery.

Like the Battle of Iswandllwana:

The Battle of Isandlwana: the Last Stand of the 24th Regiment of Foot  (South Welsh Borderers)…' Giclee Print - Charles Edwin Fripp | Art.com

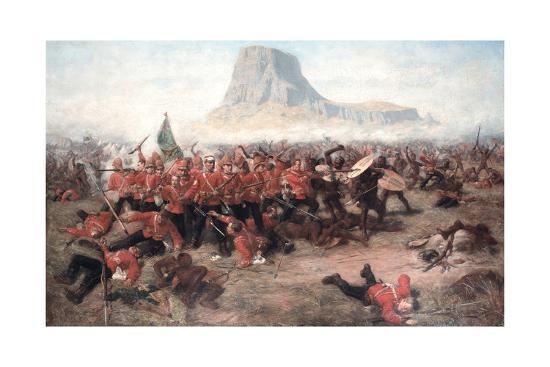
At Thermopylae, King Leonidas I of Sparta faced overwhelming odds from the Achaemenid Empire of Xerxes I over the course of three days during the second Persian invasion of Greece. As Herodotus tells us: “Here they defended themselves to the last, those who still had swords using them, and the others resisting with their hands and teeth.”

Scene of the Battle of the Thermopylae.jpg

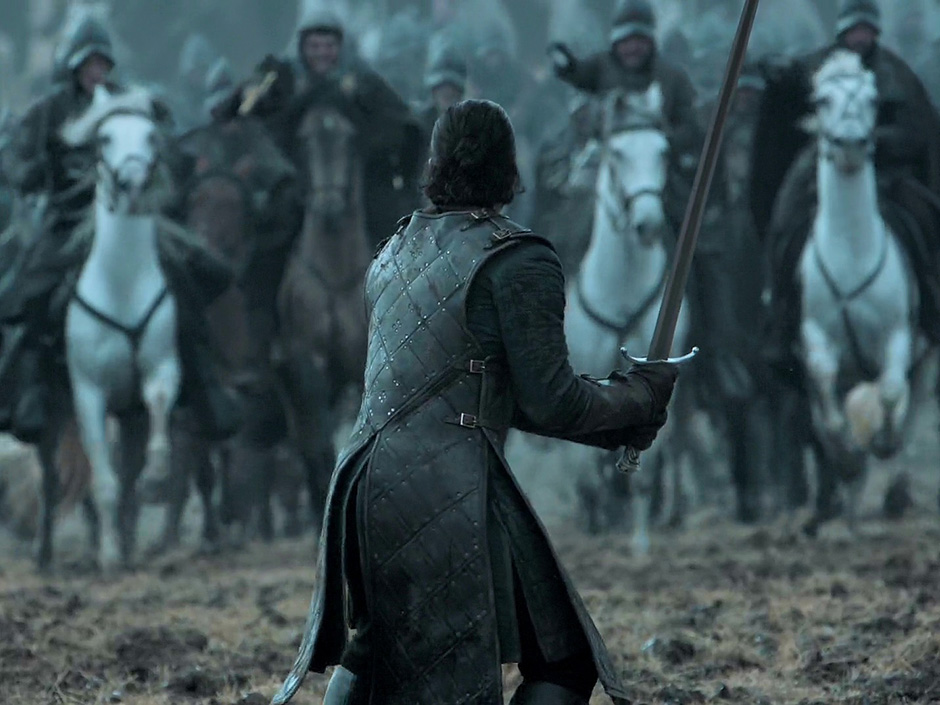
The list is endless – Masada, Mecca, Kosovo, Agincourt, Constantinople, Stand of the Swiss Guard, Fort St. Elmo, Alamo, Kabul, Little Big Horn, Rorke’s Drift, Warsaw Ghetto, Berlin.

Some were triumphant in the face of the onslaught (Agincourt) – most, well, not so. Aftr all the odds are overwhelming in last stands.

But all glorious(?) At least the poets say so.

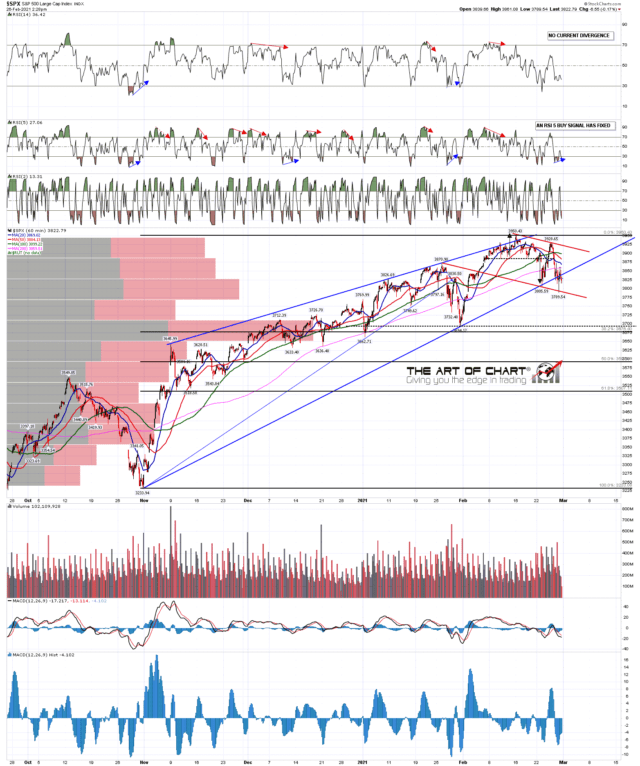
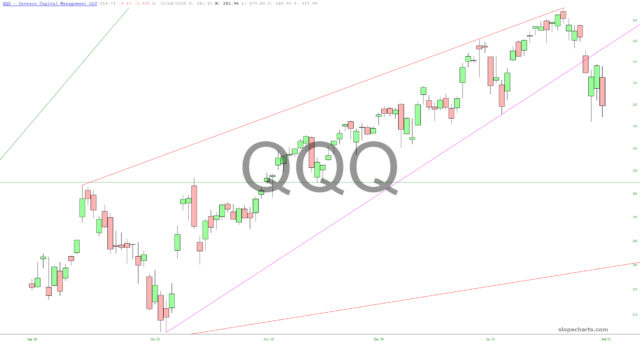
And so, in the tradition of Last Stands, we find Evil Speculator draw the SPX battle line (https://evilspeculator.com/battle-lines/). ES offers us two scenarios:

Scenario A:

  • A drop through 380 followed by a snap back higher (which is what we’re seeing in the ES futures right now).
  • From there the previous lows holds and we are done with this correction.

Scenario B:

  • A drop through 380 followed by a reversal or retest higher.
  • The retest fails or fizzles out and gravity takes over drawing us toward 370 or even lower.

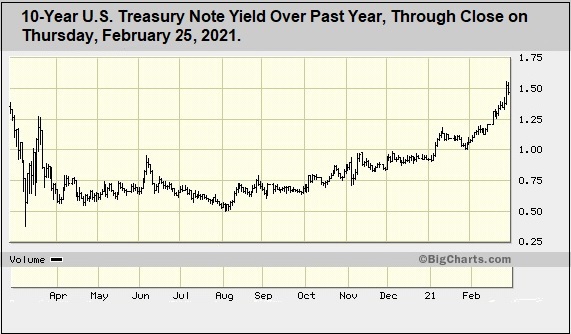
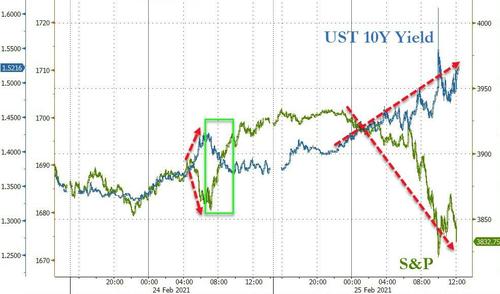
The canary in the bond “landmine” could well be ZB – treasuries.

How long it will last is anyone’s guess but the battle line has been drawn and it’s at the 156 mark. Let me be crystal clear about this: If that threshold is being breached in the near future then it will open the floodgates of panic selling.

For those of you scoring at home, here’s the latest ZB – a true last stand picture. This is where acceleration to the downside may be far too much to successfully pull out:

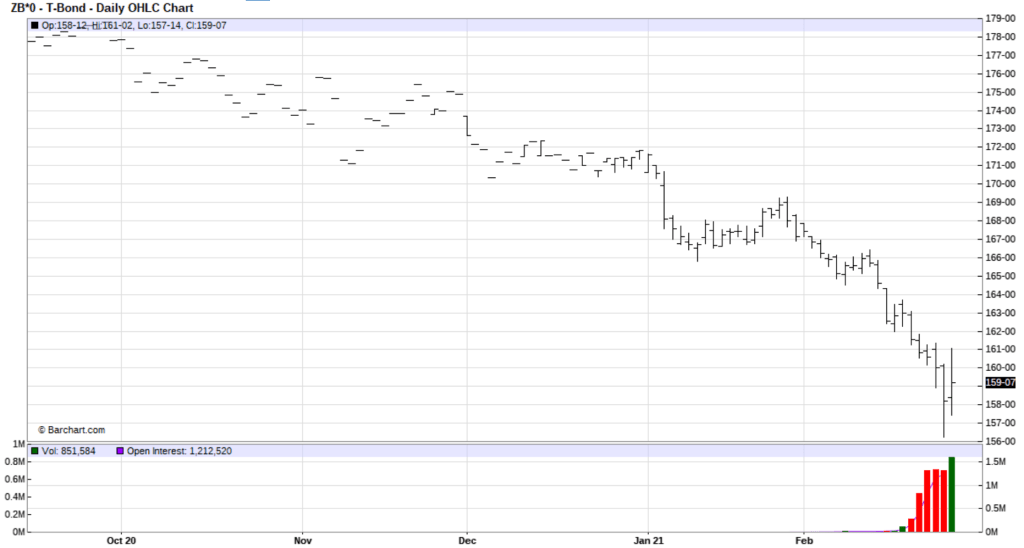
Will bonds hold the line? They’re coming up on it fast and acclerating.

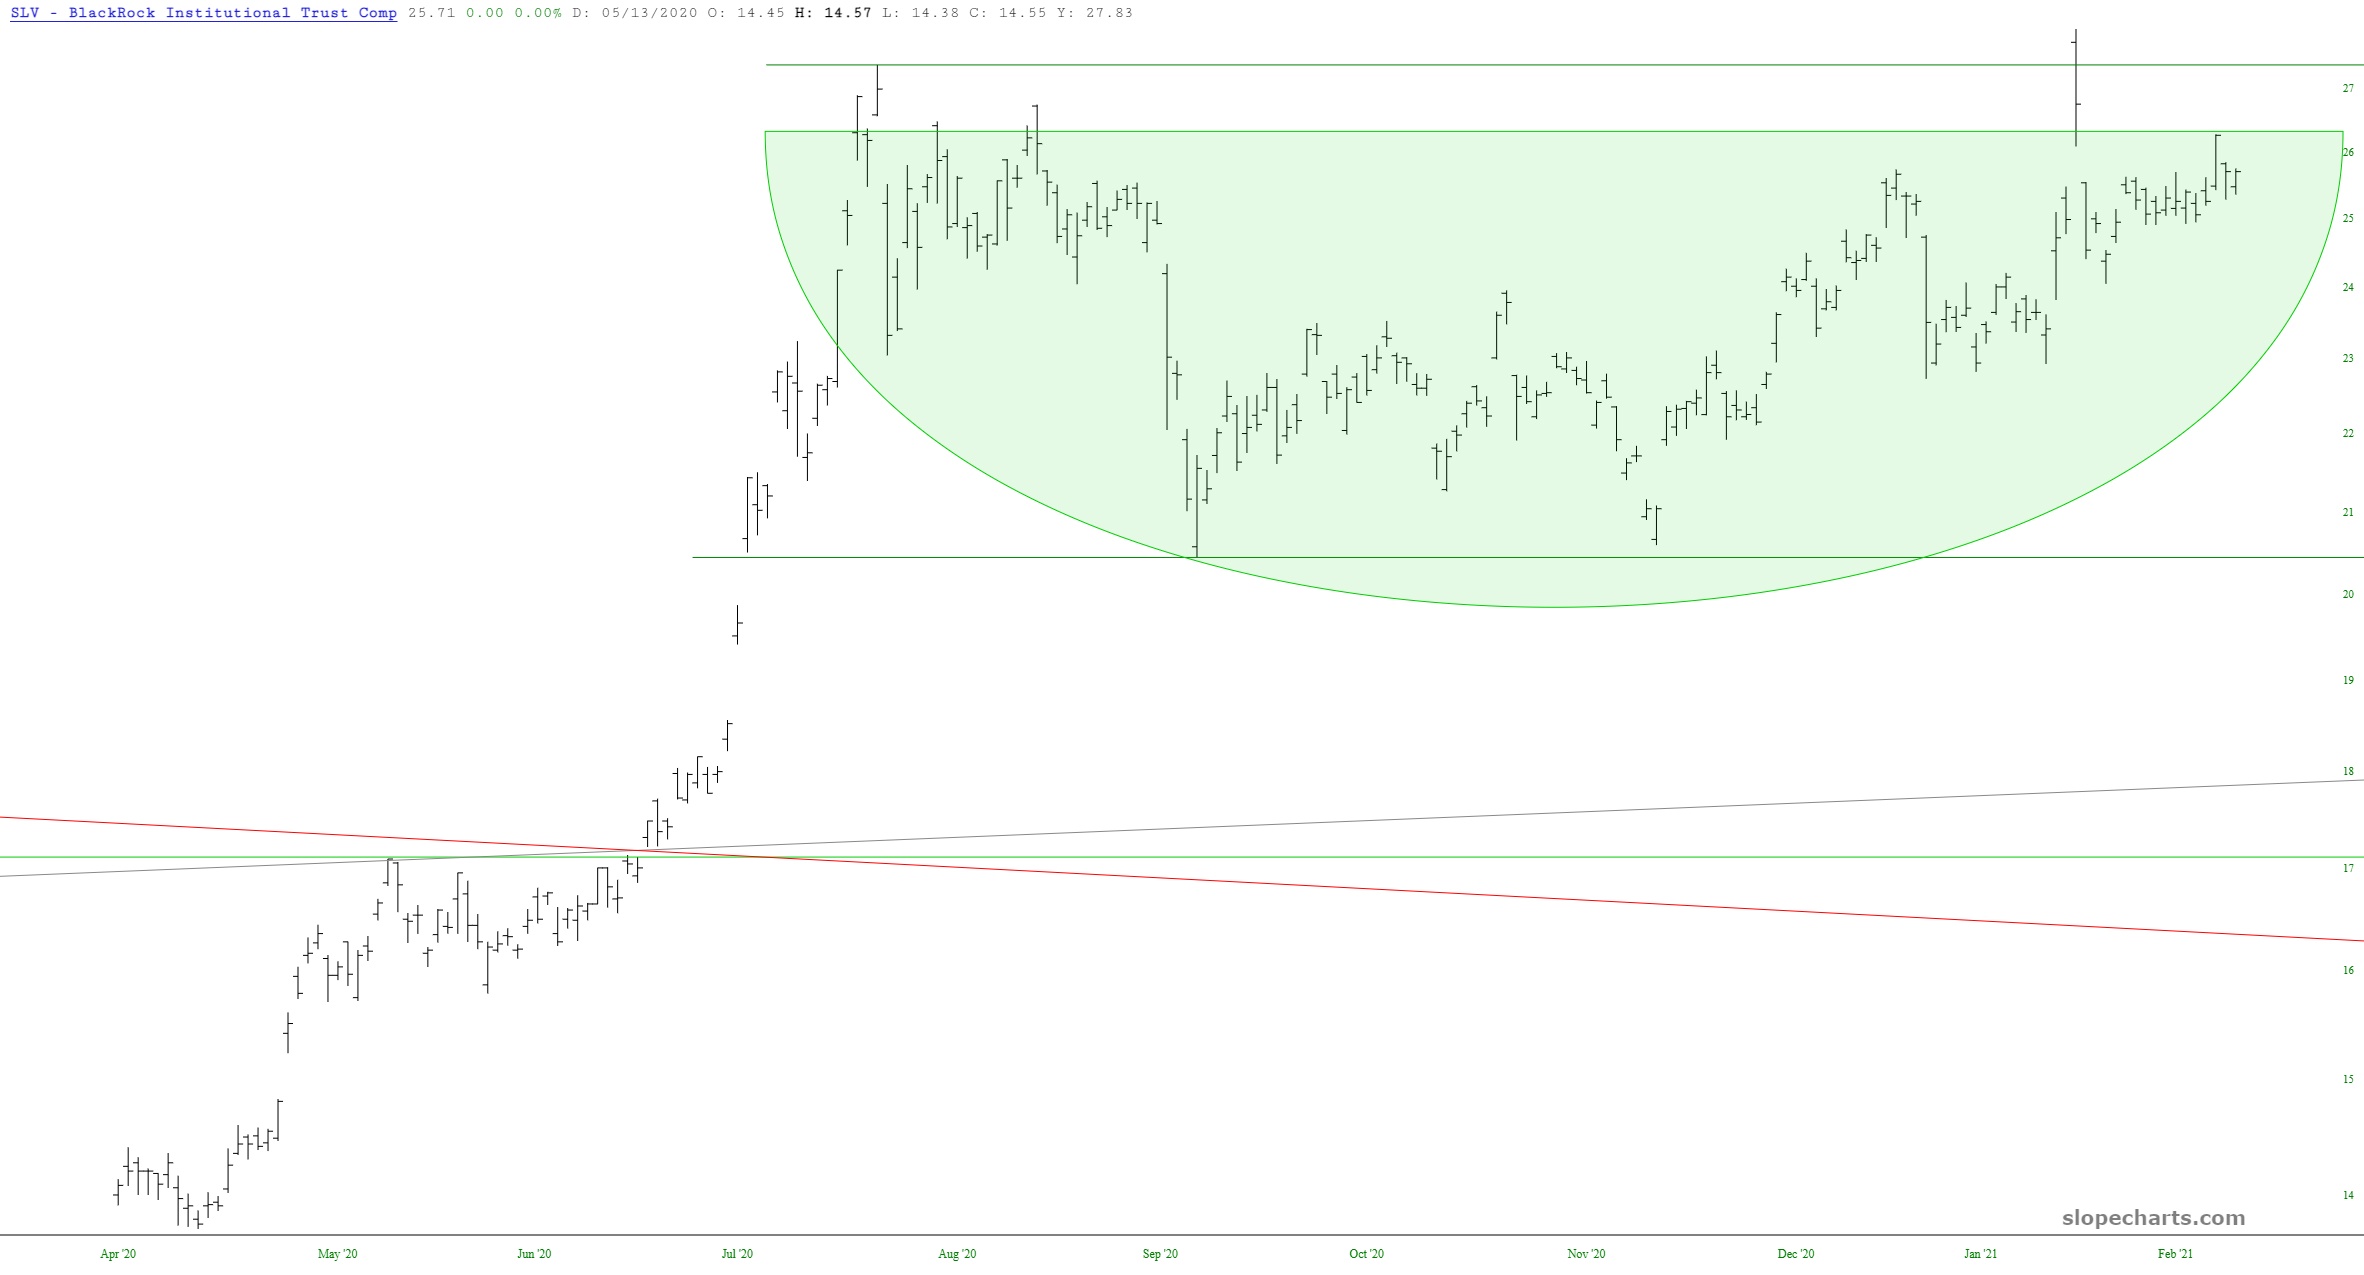
Over at Slope of Hope, Tim Knight sees bull flags forming among the rising wedges and retracements: https://slopeofhope.com/2021/02/likely-bull-flags-forming.html

Thermopylae? Or Agincourt?

Hard to say.

This story shall the good man teach his son;
And Crispin Crispian shall ne’er go by,
From this day to the ending of the world,
But we in it shall be rememberèd—
We few, we happy few, we band of brothers;
For he to-day that sheds his blood with me
Shall be my brother; be he ne’er so vile,
This day shall gentle his condition;
And gentlemen in England now a-bed
Shall think themselves accurs’d they were not here,
And hold their manhoods cheap whiles any speaks
That fought with us upon Saint Crispin’s day.

William Shakespeare Henry V, Act IV Scene iii(3)

Capitol Police Could Use a Refresher on Weapons Safety

US military weapons training provides a set of “rules” for safe handling and use of firearms.

Army, Marines, Navy, etc., they’re all very similar.

Here are 5 of the most important:

Rule 1: Treat every weapon as if it were loaded.
Rule 2: Never point a weapon at anything you do not intend to shoot.
Rule 3: Keep your finger straight and off the trigger until you’re ready to fire.
Rule 4: Keep the weapon on “safe” until you intend to fire.
Rule 5: Know your target and what is beyond it.

Seems from these photos, the Capitol Police Lieutenant on the left violated Rules 2, 3, and 5 – the guys in front of him were lucky he didn’t inadvertently shoot them.

Anybody with weapons experience knows you never put your finger on a trigger until you are in the proper combat stance (e.g., Weaver, Isosceles), cleared the area near the target, engaged the target, and are about to shoot.

At least the guy on the bottom had his finger in the proper position as required under Rule 3 – OFF the trigger.

Question remains: was he really planning to shoot unarmed trespassers?

Given the number of weapons drawn at this point, were these bozos really planning to shoot unaramed trespassers while behind locked doors and not at immediate risk of harm? If that was not their intent, why the drawn weapons?

Sure seems like they had the mindset to take a shot.

Monetary Politburo News

U.S. Treasury Note Yield Through February 25, 2021

The “Martens” at Wall Street on Parade weighed in today on the dynamics of endless money creation: https://wallstreetonparade.com/2021/02/wall-street-sends-a-message-to-the-fed-we-have-run-out-of-places-to-stuff-your-treasuries/

The practical dynamics.

As in “where all this sh___ goes” dynamics.

Recall we have a monetary politburo for all sorts of reasons you likely heard before – bankers want to offload their liquidity risk onto the public, politicians want to hide taxes in plain sight, those close to the food chain wanted an arbitrage subsidized by the public.

All true, of course.

The problem is when assets are created without regard to demand, this stuff has to go somewhere.

Let’s let the Martens spell it out for you:

That was the scene in the Treasury market yesterday – too much supply and no where to stuff it, causing a sharp spike in yields which set off a stock market selloff that left the Dow down 559.8 points or 1.75 percent on the day, while the tech-heavy Nasdaq fared far worse, losing 478.5 points or 3.52 percent.

That the Treasury market is now projectile vomiting T-notes should come as a surprise to no one. As the chart above indicates, yields on the 10-year note have been rising sharply since early August, with the yield more than tripling from 0.50 percent to an intraday spike yesterday of 1.61 percent. The 10-year note opened this morning at 1.52 percent.

The sharp and persistent rise in yields have left those who bought the T-notes at dramatically lower yields licking their wounds from heavy losses. (Prices of notes and bonds move inversely to their yields.) That has also dramatically lessened the appetite to buy more Treasuries at the current yields when the supply is expected to continue to increase as a result of rising government deficits and stimulus spending.

Another catalyst for yesterday’s selloff in Treasuries was a very sloppy Treasury auction where the government attempted to stuff $62 billion of a 7-year Treasury note into an already over-supplied market.

The spike in yields comes despite the fact that the Federal Reserve itself has been buying $80 billion each month in various maturities of Treasury notes and bonds. That started in June of last year. As of this past Wednesday, the Fed owned $4.8 trillion of Treasury securities, part of that resulting from its purchases of Treasuries (QE programs) after the 2008 Wall Street crash.

In an additional effort to hold overall interest rates down, the Fed is also buying $40 billion each month in agency mortgage-backed securities (MBS). It owns $2.18 trillion of those, much of that also resulting from the aftermath of the 2008 crash.

The Fed’s Federal Open Market Committee (FOMC) has also directed the New York Fed’s trading desk “to increase holdings of Treasury securities and agency MBS by additional amounts and purchase agency commercial mortgage-backed securities (CMBS) as needed to sustain smooth functioning of markets for these securities.”

Aside from the Fed, the other big domestic buyers of Treasury securities are the mega Wall Street banks. These banks are known as “Primary Dealers” and are contractually bound to have to buy at Treasury auctions. This is how the New York Fed describes the role of Primary Dealers:

“Primary dealers serve as trading counterparties of the New York Fed in its implementation of monetary policy. This role includes the obligations to: (i) participate consistently in open market operations to carry out U.S. monetary policy pursuant to the direction of the Federal Open Market Committee (FOMC); and (ii) provide the New York Fed’s trading desk with market information and analysis helpful in the formulation and implementation of monetary policy. Primary dealers are also required to participate in all auctions of U.S. government debt and to make reasonable markets for the New York Fed when it transacts on behalf of its foreign official account-holders.”

On top of the problem of a supply glut is the fact that these mega banks/Primary Dealers have been allowed to gobble up other banks over the years, leading to a dramatic decline in the number of Primary Dealers available to bid at Treasury auctions. In 1988 there were 46 primary dealers. By 1999, there were only 30. Today, there are just 24. (Click on the plus sign under “List of Primary Dealers” here to see the names.)

As the House Financial Services Committee continues its investigation into the structure of stock trading on Wall Street, the Senate Banking Committee needs to tackle the structure of the Fed, its cronyism with Wall Street, and the process of government debt issuance.

27% of Household Income now comes from the Government

USBEA Personal Income and Outlays: https://www.bea.gov/news/2021/personal-income-and-outlays-january-2021

Let’s think in terms of a good news/bad news joke.

Personal income increased $1,954.7 billion (10.0 percent) in January according to estimates released today by the Bureau of Economic Analysis (tables 3 and 5). Disposable personal income (DPI) increased $1,963.2 billion (11.4 percent) and personal consumption expenditures (PCE) increased $340.9 billion (2.4 percent). (BEA)

But Personal Current Transfer payments (aka government-sourced income, such as unemployment benefits, welfare checks, and so on) were up in January $5.781 trillion annualized.

That’s ~$2 trillion from the $3.8 trillion in December when it was also $2 trillion above the pre-Covid trend where transfer receipts were approximately $3.2 trillion.

And we haven’t even gotten to the good news/bad news joke.

Like consider the impact of these “hot checks” on the M2 velocity and stocks:

Now THAT’s funny!

So are your supermarket bills.

Second Largest Gas Withdrawal Recorded

range of weekly natural gas storage net changes

EIA: https://www.eia.gov/todayinenergy/detail.php?id=46916

Significant demand for natural gas in mid-February led to the second-largest reported withdrawal of natural gas from storage in the United States, according to the U.S. Energy Information Administration’s (EIA) Weekly Natural Gas Storage Report (WNGSR). Weekly stocks fell by 338 billion cubic feet (Bcf) in the week ending February 19, 2021, nearly three times the average withdrawal for mid-February. A record amount of natural gas, 156 Bcf, was withdrawn during that week in the South Central region, which includes Texas.

Colder-than-normal temperatures across much of the Lower 48 states, especially in Texas, led to increased demand for space heating. Population-weighted heating degree days (HDDs) represent temperature deviations lower than 65 degrees Fahrenheit and are weighted based on population distributions across the country. For the week ending February 19, U.S. HDDs reached 254, or nearly 40% colder than normal, according to the National Oceanic and Atmospheric Administration.

weekly net changes of natural gas in underground storage

Source: U.S. Energy Information Administration, Weekly Natural Gas Storage Report and heating degree days from National Oceanic and Atmospheric Administration, Climate Prediction Center


In Texas, the two most common space heating fuels are electricity (the primary heating fuel in more than 60% of Texas homes, according to Census data) and natural gas (36%). Increases in electricity demand also affect natural gas demand because natural gas is the most prevalent electricity generation source in Texas and in much of the South.

Estimated U.S. natural gas demand on February 14, 2021, reached 148.3 Bcf, surpassing the previous single-day record set in January 2019, according to estimates from IHS Markit. In addition, during the week ending February 19, U.S. average weekly dry natural gas production fell by 13.8 billion cubic feet per day (Bcf/d), according to estimates from IHS Markit. The decline in natural gas production was primarily because of freeze-offs, which occur when water and other liquids freeze at the wellhead or in natural gas gathering lines near production activities. Dry natural gas production fell by an estimated 10 Bcf/d in Texas alone, according to IHS Markit estimates.

Information in EIA’s Weekly Natural Gas Storage Report is also available on the Natural Gas Storage Dashboard, which shows natural gas inventories, storage capacity, prices, and consumption.

I’ve got three words to summarize all this: Modern Solar Minimum.

Solar Cycle 24 (December 2008 to December 2019) is recorded to be the weakest in magnitude in the “Space Age” (after 1957).

And the first for which radiometers aboard Earth-orbiting satellites can provide accurate and reliable lower tropospheric temperature (began in 1979). Temperatures (and sea level estimates for that matter) prior to 1979 are notoriously unreliable.

Which, of course, comprise the bulk of the IPCC dataset used to forecast future climate and sea levels.

Solar Cycle 24 is not only the weakest in solar activity, but also in average solar wind parameters and solar wind–magnetosphere energy coupling. This resulted in lower geomagnetic activity, lower numbers of high-intensity long-duration continuous auroral electrojet (AE) activity (HILDCAA) events and geomagnetic storms.

In fact, Solar Cycle 24 exhibited a ≈54 – 61% reduction in HILDCAA occurrence rate (per year), ≈15 – 34% reduction in moderate storms (−50 nT≥Dst>−100 nT), ≈49 – 75% reduction in intense storms (−100 nT≥Dst>−250 nT) compared to previous cycles, and no superstorms (Dst≤−250 nT).

The solar-wind energy flux into Earth’s magnetosphere (Ein) can explain up to 25% total interannual variance of the northern-hemispheric temperature in the subsequent boreal winter.

In other words, with a weakening cycle, the next decade or so will be very interesting.

And cold.

Ron Burgundy: Boy, that escalated quickly. I mean, that really got out of hand fast.

Was looking so good right up to crashing support.

Wedges in bonds and stocks, to be precise. Can you say “fear and loathing?”

I see a red door and I want it painted black.

Count on Tim Knight (Slope of Hope) to explain this in metaphysical terms we can all understand: https://slopeofhope.com/2021/02/the-problem-with-distortion.html

My point is that the “targets” of the Fed, like the ES, are freakish mutations that aren’t allowed to behave as a free market should, whereas there are still pockets of the equity world which more or less can actually behave As God Intended.

Well said.

ERCOT Margin Call

ERCOT is a “just-in-time” energy market without a capacity market and missing the ability to “call” adjacent systems or ready-to-go capacity to cover supply shortages.

And so, – surprise, surprise – market clearing prices can get rather spikey when confronted by high demand and limited capacity.

As reported by Zero Hedge: https://www.zerohedge.com/commodities/texas-grid-operator-warns-defaults-credit-crisis-develops

The Texas energy crisis has morphed from a power grid failure to a humanitarian emergency to a credit crisis as billions of dollars in power bills come due. 

According to FT, electricity retailers, municipal utilities, and power generation companies were purchasing wholesale energy during the crisis when rates surged to a cap of $9,000 a megawatt-hour last week, owe a whopping $50 billion. 

ERCOT, the state’s grid operator, warns that some market participants have yet to post collateral to cover some of the bills as defaults begin. 

Kenan Ogelman, ERCOT’s vice-president of commercial operations, said market participants who buy power from them have to post collateral as a down payment on energy purchases. He said some entities have “failed to deliver it.” 

“Defaults are possible, and some have already happened,” Ogelman warned.

Due to surging energy prices last week and the week before, collateral requirements jumped for power buyers. At the beginning of February, ERCOT held around $600 million in total collateral. 

On Wednesday, Exelon Corporation posted $1.4 billion of collateral with the Texas power company. Exelon said it might record losses between $560 million to $710 million due to power rate volatility when three of its gas generating plants went offline. 

Ogelman said collateral requirements would peak by the end of the week and add “financial stress” to market participants. 

The Public Utility Commission of Texas ordered the grid operator on Monday to use “discretion” on settlements, collateral obligations, and payments. 

Ogelman said there are consequences for halting payments that would cascade into problems for energy futures markets operated by Intercontinental Exchange.

“There are consequences to any pause,” Ogelman said. “I think it’s important to understand that there’s a train of dominoes, essentially, that flow through ERCOT and into other markets.” 

Sean Taylor, ERCOT chief financial officer, said there are “several billions of dollars of invoices outstanding, then it’s a matter of how much of those get paid relative to the collateral we have.” 

Taylor warned: “The next couple of days will really determine where we stand.”

“To cover shortfalls from defaulting parties, the non-profit had begun to tap an almost $1bn fund supported by electric transmission contracts,” Taylor said. 

Additional stress is developing for individual customers (such as households or companies) who were socked with huge power bills. Residential customers who had variable-rate electricity plans experienced steep increases in their monthly bills; one customer’s bill went from $660 on average to more than $17,000 this month. 

… and earlier this week, it appears the first casualty of the Texas power grid crisis is Just Energy who warned the “financial impact of the Weather Event on the Company once known, could be materially adverse to the Company’s liquidity and its ability to continue as a going concern.” 

Jumpin’ Jack Flash It’s a Gas, Gas, Gas

Texas dry natural gas production

In this morning’s “Today in Energy” (https://www.eia.gov/todayinenergy/detail.php?id=46896), US EIA explains what happened with the freeze hit:

During the cold snap that affected much of the central part of the country, U.S. dry natural gas production fell to as low as 69.7 billion cubic feet per day (Bcf/d) on February 17, a decline of 21%, or down nearly 18.9 Bcf/d from the week ending February 13. Natural gas production in Texas fell almost 45% from 21.3 Bcf/d during the week ending February 13 to a daily low of 11.8 Bcf/d on Wednesday, February 17, according to estimates from IHS Markit. Temperatures in Texas averaged nearly 30 degrees Fahrenheit lower than normal during the week of February 14.

The decline in natural gas production was mostly a result of freeze-offs, which occur when water and other liquids in the raw natural gas stream freeze at the wellhead or in natural gas gathering lines near production activities. Unlike the relatively winterized natural gas production infrastructure in northern areas of the country, natural gas production infrastructure, such as wellheads, gathering lines, and processing facilities, in Texas are more susceptible to the effects of extremely cold weather. [Emphasis added]

After reaching a daily low on February 17, natural gas production in Texas began increasing as temperatures started to rise. Daily production reached an estimated 20.9 Bcf/d on February 24, only about 0.3 Bcf/d lower than the average in the week ending February 13.

That explains the evaporation of dispatched power.

What about the nondispatched? The wind turbines?

Well, Max Rust and Kyle Kim already addressed that in the piece in the aftermath of the freeze: https://www.wsj.com/articles/why-cold-weather-cut-the-power-in-texas-11613765319

Following a similar weather event in 2011, plant operators in Texas created a set of best practices for winterizing equipment, but these were voluntary recommendations, according to Dan Woodfin, senior director of system operations at Ercot.

Another major source of Texas’ electricity also susceptible to the cold contributed in part to the outages. Wind turbines installed in warm weather climates can generally operate above -4 degrees Fahrenheit but will shut down in colder temperatures. Ice buildup on the blades can also lead to slower rotations and even shut down a turbine. In northern climates such as Canada and Scandinavia, winterization measures are typically built into the turbines during manufacturing, but can be retrofitted to turbines already in operation.

Dr. Judith Curry on Estimating Climate Risk Using Models that Fail Backtests

Representative Concentration Pathway - Wikipedia

IPCC AR5 (2014) presents 4 emission pathways which are at the heart of the climate change debate. There are a range of other topics that are also debated – notably, the atmospheric and ocean physics effects from GHG concentrations assumed. Those effects are further attenuated by factors that modeled by IPCC such as a more robust coupled atmospheric-oceanic physics, astrophysical and geophysical dynamics.

The emission scenario dominates the first order effect produced by the IPCC climate models. That first order effect is amplified by the transient climate sensitivity (TCS – the feedback effect from higher concentrations.

So, depending on which RCP scenario you assume, you can get a wide range of effects.

Oh, and not to go off-point too far, TCS estimates are now coming in at 1/2 – 1/3 below early nightmare assumptions

Anyway, back to the point.

CarbonBrief provides a very intelligent analysis of the RCP scenarios (https://www.carbonbrief.org/explainer-the-high-emissions-rcp8-5-global-warming-scenario). It’s worth a read if you have even a casual interest in this subject.

It’s also worth reading the origin of these scenarios starting with van Vuuren et al. (2011). Among other things, CarbonBrief warns against using RCP 8.5. Quoting Professor van Vurren:

“RCP8.5 has probably become less likely compared to 2008-2011, when the scenario was developed and published. The reason is that since that time several countries and companies have adopted climate policy inspired by the Paris Agreement, but also the costs of solar photovoltaics and wind have come down much more rapidly than originally expected. Again, it does not mean that the scenario is implausible – and thus not relevant as a scenario to explore high-end forcing – but it is probably not the most likely business-as-usual case. It wasn’t originally, and it isn’t now.”

In recent years, insurance modelers have attempted to translate IPCC forecasts to economic losses. One such model by AIR does what CarbonBrief and other scientists advise not to do: use RCP 8.5.

Why does AIR use RCP 8.5? Well, why does any consultant tell a horror story? A lot of climate consultants are out there right now telling such stories. So why indeed? Cjui bono?

In a recent post, Dr. Judith Curry takes issue with an AIR model recently made public: https://judithcurry.com/2021/02/15/assessment-of-climate-change-risk-to-the-insurance-sector/

Curry offers an in-depth critique of AIR which is an otherwise well-respected company:

AIR Worldwide, a respected catastrophe risk modeling and consulting company, has recently published a report Quantifying the Impact from Climate Change on Hurricane Risk.  AIR’s assessment has three components:

  • Hazard component (relates to the frequency and intensity of events)
  • Engineering component (relates to physical assets at risk)
  • Financial component (relates to monetary losses)

The AIR Report purports to “capture the full range of plausible events that could impact an area.”

My critique focuses solely on the hazard component. A summary of my analysis is provided below:

  1. The driver for AIR’s assessment is warming associated with the emissions/concentration scenario RCP8.5, which AIR refers to as a ‘business as usual scenario.’  In fact, RCP8.5 is increasingly being judged as implausible by energy economists, and is not recommended for use in policy planning.
  2. The hurricane risk from climate change focuses on the number and intensity of U.S. landfalls in a changing climate.  Their scenario of the number of major hurricanes striking the U.S. by 2050 is judged to be implausible for medium emissions scenarios such as RCP4.5.
  3. The sea level scenarios used in the AIR Report are higher than the recent IPCC consensus assessments and are arguably implausible for medium emissions scenarios.
  4. The AIR Report ignores the ‘elephant in the room’ that is of relevance to their target period to 2050: the Atlantic Multi-decadal Oscillation (AMO). A shift to the cool phase of the AMO would arguably portend fewer major hurricanes striking the U.S.

Whereupon Dr. Curry painfully dissects AIR through a thousand cuts.

Too bad for AIR – a respected company that any physicist will likely observe in this instance their consultants got a bit ahead of themselves.

References:

AR5 Synthesis Report: Climate Change 2014. (n.d.). Retrieved February 25, 2021, from Ipcc.ch website: https://www.ipcc.ch/report/ar5/syr/

Curry, J. A. (2021, February 15). Assessment of climate change risk to the insurance sector. Retrieved February 25, 2021, from Judithcurry.com website: https://judithcurry.com/2021/02/15/assessment-of-climate-change-risk-to-the-insurance-sector/

Explainer: The high-emissions ‘RCP8.5’ global warming scenario. (2019, August 21). Retrieved February 25, 2021, from Carbonbrief.org website: https://www.carbonbrief.org/explainer-the-high-emissions-rcp8-5-global-warming-scenario

van Vuuren, D. P., Edmonds, J., Kainuma, M., Riahi, K., Thomson, A., Hibbard, K., … Rose, S. K. (2011). The representative concentration pathways: an overview. Climatic Change109(1–2), 5–31.

Hi-Yo, Silver! Away!

Tim Knight (Slope of Hope): https://slopeofhope.com/2021/02/winding-up-for-the-pitch.html#more-193985

Silver is looking better by the day………

What SLV needs to do is break above 26.3, then we’re probably off to the races. The long-term chart of silver is very encouraging. This is all augmented by the fact that our friends in Gainesville think gold and silver are totally doomed.

Now here’s “old school”:

And here’s something a bit more contemporary: