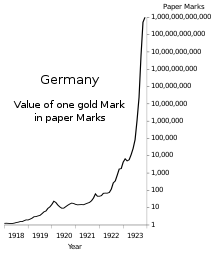
When we compare Weimar Germany a century ago to Oligarch America today, it’s easy to get a sense of deja vu.

So how does this play out?
As always, Chris Whalen can explain: https://www.theinstitutionalriskanalyst.com/post/the-great-correction-of-2025
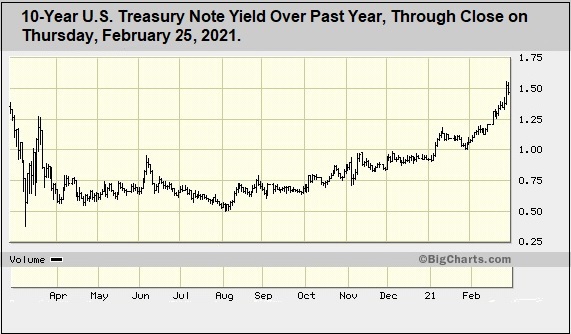
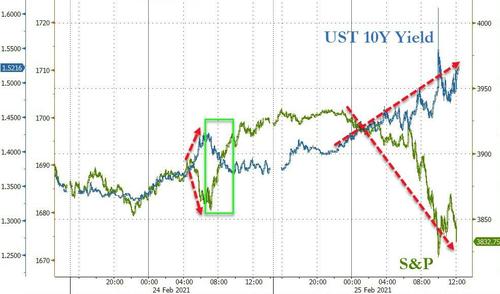
In this issue of The Institutional Risk Analyst, we focus on the global tendency toward inflation even as economists insist that price increases remain too low. Everything from bank stocks to bitcoin has been lifted in nominal value by the manic actions of central banks, which make assets scarce even as these banksters with PhDs subsidize exploding public debt issuance. Thus long term bond yields are rising in response.

Do you think Tesla (NASDAQ: TSLA) or bitcoin are the only assets rising fast in this Fed-induced inflation? No. Can you have inflation and debt deflation at the same time? Yes, this QE-fueled price surge is just a pause in the general tendency toward debt deflation. The confluence of these two facts may mean growing demand for dollars and dollar assets in the near term, not less as some analysts suppose. But little of this helps American consumers in terms of jobs or real income.
The flow of new IPOs in the equity markets propelled by special purpose acquisition companies or SPACs illustrates the problem. The special purpose vehicle, of course, is generating returns for the sponsors. Creating investor value is another matter. It is interesting to note that in 2020, more than $12 billion in SPACs were financed via PIPEs, or private investments in public equity.
PIPEs “are mechanisms for companies to raise capital from a select group of investors outside the market,” CNBC reports. “But as PIPEs are increasingly being deployed in conjunction with a surge in SPAC mergers, a larger group of fund managers are seeking access to this security, with limits on who and how many can invest. The heightened prevalence of this product is raising concerns about the potential lack of understanding among the broader cohort of SPAC investors about how these investments work.”
Even as Washington goes off the rails in terms of fiscal policy and many other aspects of national governance, around the globe demand for dollars and near-derivatives is growing. And even as the purchasing power of the dollar declines, the greenback’s popularity grows inversely to value. Liquidity, not quality, is the key criteria it seems.
When we hear people talk about the impending collapse of the dollar, we naturally think collapse into what precisely? When we sell dollars, we take what on the other side of the trade? Bitcoin? Gold? Euros? Nope, too small. None of the available substitutes even begins to have sufficient mass to act as an alternative to the dollar.
Ponder the dilemma of the Middle Kingdom under dictator Xi Jinping. Even as China attempts to use a “dual circulation” strategy to rebalance the economy away from dependence upon the US and other nations, and toward greater focus on supposed internal demand, it faces few good financial alternatives to export led growth. The yuan is inconvertible and cannot support significant investment activity. Only the dollar is big enough for China’s economy.
The tortured liquidation of HNA suggests China remains financially unstable, in part because of the clumsy policies of the Chinese Communist Party. As Barron’s notes, we are still at the beginning of this financial unwind. “It wasn’t cheap credit that led to excesses of HNA or for that matter Anbang, Ant, or Wanda Dalian, but a shift in government policy,” Yukon Huang, senior fellow at the Carnegie Endowment for International Peace and former World Bank country director for China, told Barron’s.
The combination of financial incompetence and rigid policies emphasizing state-led growth, seems hardly a prescription for success. Again, the very messy unwind of HNA is the result of deliberate government policy in Beijing. Just as the majority of US economists think inflation is not a problem, a majority of foreign analysts of China believe that the country’s growing dependence upon state run enterprises and party direction is somehow bullish for economic growth. The HNA example suggests otherwise.
Meanwhile in the US, chaos reigns supreme. The Congress is in a state of disarray after completing the second, unsuccessful trial of President Donald Trump. The city built upon a swamp is focused upon negotiations for economic rescue legislation, but is a rescue required? Outside Washington, an economic surge led by housing is building due to the latest round of monetary manipulation by the Federal Open Market Committee.
The US is in the midst of a bull market in residential real estate that easily rivals the mid-2000s. Not only are home prices currently rising at rates higher than in 2005, but the rate of increase is accelerating due to scarcity of existing homes in many markets. Suburban residential and commercial assets are in great demand, as evidenced by the migration of people and business out of urban centers such as New York City.
In upscale destination markets around the country, more than a decade worth of inventory of pricey and thoroughly overbuilt vacation homes has been consumed in the past year. A wave of buyers fled urban areas such as San Francisco, Los Angeles and Chicago for the less crowded climes of Idaho, Colorado, Utah and Montana. None of these folks are waiting for $1,400 checks from Washington.
A torrent of smart and entitled money crashed upon these small markets and their residents, causing swings in property values that leave many real estate professionals agape. But aside from the benevolence of coastal cash liquefying often glacial mountain real estate markets, there is not a great deal of benefit here for the US economy. Just another ridiculous and entirely American style misallocation of resources and on a transcontinental scale.
When the great correction from the equally great monetary easing comes in 2025 or 2026, prices for homes, stocks and yes even TSLA and bitcoin are likely to suffer. The generic wave of demand for assets will subside and prices will begin to reflect some notion of fundamental value. Just remember that 2020 is likely to be the floor of the next market reset five years out. The price increases between now and then are, well, pure inflation.
And after the great correction, the dollar will still be the global means of exchange, but Americans will have lost a huge amount of purchasing power in the process. Inequality will be even worse and legions of Americans will be homeless and without work, trapped in costly urban ghettos where living expenses are astronomical. And all the while, the economists at the Federal Reserve Board and Treasury Secretary Yellen will tell us that inflation is too low.


