GME Gamma Squeeze – the Movie

SpotGamma: https://spotgamma.com/gme-gamma-squeeze/?utm_source=ZeroHedge%20GME%20Squeeze&utm_medium=ZH%20Website&utm_campaign=ZeroHedge%20GME%20Squeeze

In late January 2021, GameStop experienced a once-in-a-decade squeeze that has captivated the world’s attention. This was a premeditated and programmatic exercise, orchestrated by coordinated stock and option buying across the retail and professional community, that resulted in large institutional entities losing billions of dollars. These investment houses with significant short positions did not expect a stock with GameStop’s fundamental profile to increase +2,500% in price over less than three weeks; therefore, they did not have the controls in place to handle the incredible levels of stock and call option purchases. The frenzy drew comments from the White House, provoked a social media crackdown, caused brokerage units to restrict trading, and has led to a Congressional hearing on GameStop on Thursday, February 18th.   

At SpotGamma, we offer the following analysis, segmented into three phases:

Phase One: The Setup

  • This is where retail investors started planning for the event
  • These retail investors started loading up on call options ahead of the coordinated large stock buying activity in phase two 

Phase Two: The Weaponized Gamma Squeezes

  • In the first squeeze, retail investors relentlessly bought stock and call options 
  • In the second squeeze, the super squeeze, several factors rocketed the stock price upward. They include stock buying, call buying, put selling, celebrity engagement, forced stop-losses, and market makers buying stock to hedge options exposure

Phase Three: The Unwind

  • This is where stock and options became too expensive for retail investors and declining volatility led to market makers selling stock they owned as hedges
  • Coupled with new trading restrictions imposed by the brokers, the stock price crashed back down more than 80pct from its highs in less than two weeks 

The Setup 

Phase One: Early in January 2021, Reddit/WSB and other retail traders began to focus on GME as a buying opportunity…. 

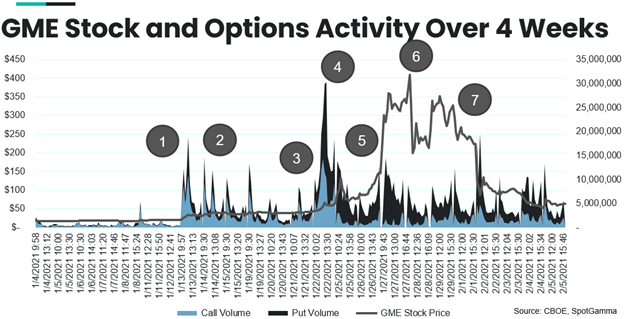
(1) January 11th [Initial Attention]: GameStop recruited a highly-respected industry veteran to their Board (Chewy Founder, Ryan Cohen). This garnered enthusiasm from the retail community and acted as the initial catalyst for these investors to start discussing GME as a potentially exciting stock to own. There was some initial buying in the $15-$20 range, then the stock quickly shifted higher to the $35-$40 range. 

(2) January 13th-20th [Loading Up]: Members of the Reddit/WSB community started purchasing large amounts of call options. This significant call buying began to form the basis for the first of two dramatic upward stock movements within the “Weaponized Gamma Squeeze” setup.  A “gamma squeeze” can occur when a trader or group of traders purchase call options in bulk, causing market makers who sold them these options to buy the stock as a hedge.  This aggressive forced stock buying adds to the stock price moving steeply upward and pushes the stock price higher as market makers scramble to buy incrementally more stock at rapidly increasing prices.

This type of trade is not unique to GameStop.  Just last summer, SpotGamma coined the term “Weaponized Gamma” when in August ’20 we saw large and concentrated options positions in several top technology stocks. We assigned the term “weaponized” to connote the idea that options were being purchased for the explicit purpose of pushing market makers to purchase stock rather than investing with a belief in the company’s performance or value.

Here, again, “Weaponized Gamma” applies to the GameStop event because it’s clear that retail traders understood the concept of a “gamma squeeze” and collectively coordinated their options purchases to initiate large market maker stock purchases.  Their action pushed the stock price up – “weaponization”. This snowball effect caused GameStop’s stock to increase as market makers hoped the call buying would stop… while instead the next stage of buying caused even more powerful pressure.

(3) January 21st [Strength in Numbers]: Citron Research published a sell recommendation research report on GameStop.  This report drew the ire of the Reddit/WSB community, which bonded tightly as one against “Wall Street”. This retail group understood the pain they could inflict through coordinate levered purchases of both call options and stock. So, they organized to exact maximum pain for the institutional complex with full disregard for what they viewed as elitist backlash.  On January 22nd, call option volumes hit their peak, as you can see in the chart below.

GME Call Volume, Put Volume

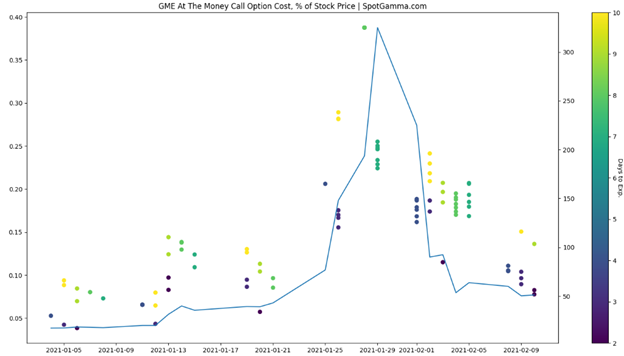
Additionally, this activity displayed in the chart below shows the relative cost of an “at the money option” (an option with a strike equal to GME’s current price).  At the start of January, a trader would pay essentially 5pct of the stock’s price for this option, roughly $1.25 per contract.  As the squeeze began, options prices rose dramatically and that same option cost more than 35pct of the stock’s price for this option, upwards of $75.  This means on both a relative and absolute value, the calls became extremely more expensive.

GME Options Costs

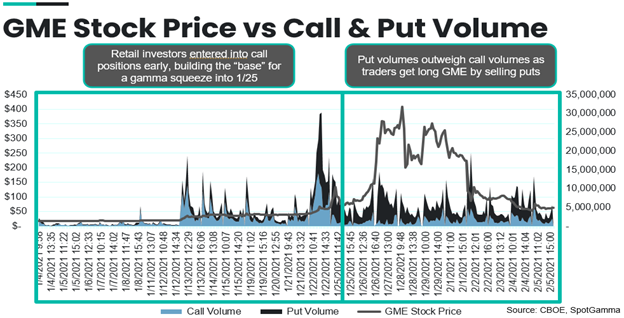
What is equally fascinating, and central to understanding the entirety of the GME trade, is that as these call volumes reached their highs, put options volumes also hit their peak.  As we will explain in Phase 2, we believe this influx of put volumes was key to sustaining the GME stock price and helped fuel the second “super squeeze”.


The Weaponized Gamma Squeezes

Phase Two: Reddit/WSB Traders Drove GameStop to Shocking Heights Pressuring Dealers to Buy GameStop Shares

(4) January 22nd-25th [The First Push, Squeeze #1]: In the days following the Citron research report, retail investors continued to purchase stock and options as a large collective community. They felt more and more emboldened as they made progress in pushing the stock price higher from $50-$60 a share up over $125. Eventually, we saw some large funds that had taken significant losses, including Melvin Capital.  These funds breached their borrowing and leverage capacity and were forced to buy back their short positions on January 25th. Again, at the root of this buying momentum was a squeeze that caused GameStop’s stock price to spike over 200pct higher intraday, which forced options dealers to buy stock at higher prices just to maintain their hedges.  In summary, we saw buying activity driven primarily by call options purchases forcing dealers to buy stock into a short-covering rally during the first gamma squeeze.  

(5) January 26th-27th [The Super Squeeze, Squeeze #2]: At this point, we hypothesize that the key buyers shifted from the “retail” sector to “institutional.”  We have dubbed the price action associated with this move as the “Super Squeeze”.

As news broke that Melvin Capital needed a bailout, Reddit/WSB investors felt they were winning.  This became a movement.  Even celebrities began to show their “support” for GameStop which in turn engaged an even larger retail crowd to buy stock.

The next day, following the dramatic intraday 200pct rise and fall of GME on January 25th, it appeared to many as if the squeeze was over.  On a quantitative basis, the initial gamma squeeze seemed to reset and short covering subsided. However, at SpotGamma we observed that the number of put options traded increased sharply. You can see in the chart below that total call open interest (light blue) did not change materially throughout the entire period, despite the stock price moving much higher. However, put interest (dark grey) surged as the stock gained in price. 

GME Call vs Put Open Interest

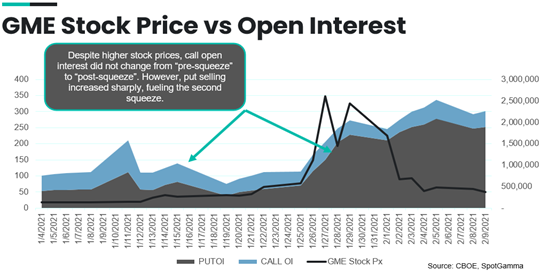
Traditionally when a stock price moves higher traders will often buy puts, and dealers (who are short puts) will short stock as a hedge. However, we believe that that bulk of these put flows were traders SELLING puts. This forced options market makers to accelerate their stock buying hedges.  This activity helped fuel the upward momentum and create the “super squeeze.”  Again, as GME stock price was increasing, the market makers bought hedges and the short sellers bought stock to cover their short positions, thereby creating extraordinary upward pressure.

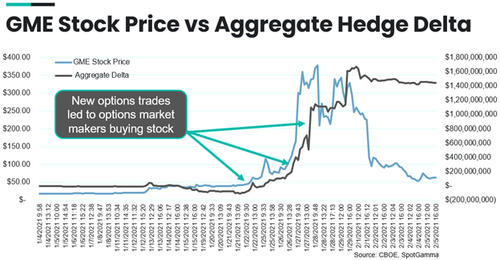
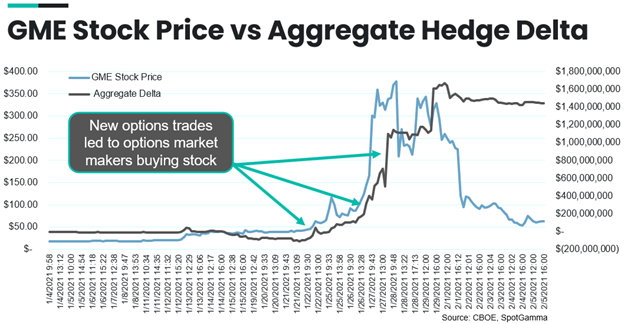
As a visual representation of this event, the chart below presents a method of valuing the option market maker risk (exposure) caused by these new trades.  The aggregate delta reflects the directional exposure created by all of the GME options trades. Since this figure is extremely positive, it shows that the independent GME options traders profited from moves higher in GME stock. Conversely, it shows how the market makers (who are on the opposite side of these trades) had a large and growing requirement to buy stock to hedge their positions.  Here, we present this on an aggregate basis to illustrate just how much value in stock had to be purchased the morning of January 27th.

To summarize the reasons for the Super Squeeze, which propelled GameStop shares from $80 per share to over $450, the following events were most impactful:  

  • Gamma-Squeeze:    Options market makers bought stock to hedge options risk
  • Stock Purchasing: Retail collaboratively and aggressively purchased stock
  • Short-Covering: 400pct stock price rise forced short investors to buy stock

The Unwind

Phase Three:  Expensive Stock and Options Prices, Coupled with Trading Restrictions, Drove GameStop Price Back Down to $60 Per Share

(6)  January 27th-28th [Expensive and Controlled Dynamics]:  Following this second big push, many traders wondered what would happen next.  Would we see a third leg of this squeeze send GameStop stock price to $700?  The answer we all know now is the trade stalled out, and at SpotGamma, we believe there are three primary reasons:

Reason one: Stock and options were too expensive. At more than $300 per share, the call prices and stock price cost too much in buying power for the retail crowd to continue pushing the stock higher.  The leverage provided by trading firms such as Robinhood maxed out and the support waned, as retail traders were unable to buy more stock, and in some cases, were forced to sell their existing long positions.

Reason two: Hedging requirements declined.  As the stock price stalled, the price of options (measured by the implied volatility) meant the market makers who were long stock no longer needed their positions and could sell them, putting downward pressure on GameStop’s share price.

Reason three:  “Big Brother” clamped down.  On the night of January 27th, social media sites such as Reddit and Facebook blocked message boards discussing GME.

(7)  January 29th-Feb 4th [Downward Slide]:  With these high prices, new controls, and market interventions, the stock price slide was progressive with a few days of intermittently volatility.  Again, during this period, since options dealers were able to sell the stock they bought as hedges, they eventually pushed the stock steeply lower in a matter of hours.  Eventually, the stock broke back below $100 per share by February 2nd and below $60 per share on February 4th. 

GameStop was not the first stock to squeeze higher and it will not be the last.  At SpotGamma, we will consistently and reliably analyze these dynamics across more than 3,500 stocks and indices to bring our subscribers relevant actionable information.  We believe with the significant number of new trading accounts opened following the GameStop drama that this is the beginning of more options volume and there will be significant momentum across the derivatives markets in the years to come. 


mRNA Vaccine Safety

A health0care worker administers a vaccination through a car window to an older man

Remmel, A. (2021):

COVID vaccines and safety: what the research says

It is clear that coronavirus vaccines are safe and effective, but as more are rolled out, researchers are learning about the extent and nature of side effects.

As people around the world receive COVID-19 vaccines, reports of temporary side effects such as headaches and fevers are rolling in. Much of this was expected — clinical-trial data for the vaccines authorized so far suggested as much. But now that millions of people are vaccinated, compared with the thousands enrolled in early studies, reports of some rare, allergic reactions are surfacing, and questions are arising about whether any deaths are linked to the shots.

There is no question that the current vaccines are effective and safe. The risk of severe reaction to a COVID-19 jab, say researchers, is outweighed by the protection it offers against the deadly coronavirus. Nature looks at what scientists are learning about the frequency and nature of side effects as huge numbers of people report their reactions to physicians and through safety-monitoring systems, such as smartphone apps.

How many people experience common side effects from COVID-19 vaccines?

For the two available messenger RNA (mRNA) vaccines — one made by Moderna at Cambridge, Massachusetts, and the other developed through a collaboration between Pfizer in New York City and BioNTech in Mainz, Germany — a significant portion of people experience non-serious reactions, such as injection-site pain, headache and fatigue. These vaccines deliver bits of RNA that code for coronavirus proteins, which the body mounts a response against.

According to data from the US Vaccine Adverse Event Reporting System (VAERS), about 372 out of every million administered doses of the mRNA vaccines lead to a non-serious reaction report. This number is lower than would be expected from clinical-trial data, which indicated that at least 80% of people would experience injection-site pain. Researchers running trials monitor patients closely and record every reaction. VAERS, meanwhile, relies on health-care workers and vaccinated individuals to self-report side effects.

Tracking Side Effects. Graphic detailing side effects people reported after receiving the Pfizer–BioNTech vaccine.
Source: CDC/V-Safe/Tom Shimabukuro

So far, reactions to the mRNA vaccines are similar. These vaccines are administered in a two-dose regimen: the first shot triggers an immune reaction, and the second is a ‘booster’ that strengthens the body’s ability to fight the coronavirus. For the Pfizer–BioNTech vaccine, which has been in use longer than the Moderna vaccine and therefore has generated more data, side effects increase with the second dose (see ‘Tracking side effects’).

In the United Kingdom, three million doses of another vaccine, developed by the University of Oxford and pharmaceutical firm AstraZeneca, have been doled out. This vaccine, which also requires a two-dose regimen, contains a inactivated cold-causing adenovirus with genetic instructions for making coronavirus proteins to trigger immunity. According to UK safety-monitoring system the Yellow Card Scheme, about 4,000 doses out of every million administered lead to adverse reactions. Again, clinical-trial data suggest that a higher frequency is more accurate: around 50% of participants had injection-site pain, headache or fatigue, according to data reported to the European Medicines Agency (EMA).

Few people have received a second dose of the Oxford–AstraZeneca vaccine because the United Kingdom used its supplies to administer a first dose to as many people as possible, but clinical-trial data presented to the EMA suggest that side effects of the second shot are milder than those caused by the first.

Safety data for shots rolling out in other parts of the world, such as the COVID-19 vaccines in China, are harder to come by. Preliminary data from clinical trials of the adenovirus-based Sputnik V vaccine in Russia suggest its most common side effects include flu-like symptoms and injection-site reactions1.

How does that compare with side effects from an annual flu shot?

US authorization of first COVID vaccine marks new phase in safety monitoring

At least for the mRNA vaccines, physicians are seeing more side effects than for flu shots, says Helen Chu, an infectious-disease specialist at the University of Washington School of Medicine in Seattle, who directs the Seattle Flu Study. In clinical trials for the Pfizer–BioNTech vaccine, for instance, 75% of participants reported a ‘systemic reaction’, such as headache, fever or chills. In a clinical trial for the common influenza vaccine Flubok Quadravalent, around 34% of participants aged 18–49 had a systemic reaction. Side effects were even less frequent in study participants who were at least 50 years old.

Chu says the mRNA COVID-19 vaccines generate a particularly strong immune response that increases the risk of side effects, although this also means that the vaccines are working. She notes that her second dose of the Pfizer–BioNTech vaccine made her ill. “I got the vaccine, and 6 hours later, I had chills, a high fever, muscle aches and I went to bed for 24 hours,” she says. “Then by 36 hours later, it was totally over and I was back to normal.” But Chu would rather be temporarily ill from a vaccine than deal with COVID-19, “a potentially mortal disease that could kill me”, she says.

Have investigations linked any deaths to a COVID-19 vaccine?

Could mixing COVID vaccines boost immune response?

Although some have questioned whether the vaccines have led to deaths, none have been directly attributed to a COVID-19 jab. After 33 elderly care-home residents in Norway died within 6 days of receiving the Pfizer–BioNTech vaccine, investigations by both the Norwegian Medicines Agency and the World Health Organization concluded that these deaths were in line with normal death rates in this age group and that the vaccine is still safe for older people. India’s Ministry of Health and Family Welfare reported 27 deaths in the country, but none of these have been linked directly to a COVID-19 vaccine either.

It is “extremely difficult” to definitively link a death to the vaccine itself, says Hilda Bastian, a writer and scientist who specializes in validating evidence-based health claims. That is partially because the deaths reported so far have occurred days or weeks after an injection, making it hard to rule out other circumstances. Another reason is that, right now, clinicians are prioritizing vaccines largely for a population of older people with underlying health conditions. Most of those who have died after vaccination have been in this group, according to reports from the United Kingdom and the United States.

What do researchers know about the rare, but severe, allergic reactions to the vaccines?

Search for better COVID vaccines confounded by existing rollouts

The Moderna vaccine elicits about three anaphylactic reactions per million doses administered, and the Pfizer–BioNTech vaccine triggers five reactions per million doses, according to VAERS data. This is a higher rate than most other vaccines — including annual flu shots, which trigger anaphylaxis for only one out of every million doses administered2. For the Oxford–AstraZeneca vaccine, 30 cases of anaphylaxis have been confirmed overall so far, out of a little more than 3 million administered doses. Vaccine specialists expect that these rates might change as more shots are administered.

Although some people have required hospitalization, all have fully recovered. Public-health officials advise people with a history of allergies to any of the vaccines’ ingredients not to get a COVID-19 jab.How COVID unlocked the power of RNA vaccines

Unlike COVID-19, anaphylaxis is treatable with drugs such as epinephrine if caught quickly, says Paul Offit, a vaccine and infectious-disease specialist at the Children’s Hospital of Philadelphia in Pennsylvania, who participated in the US Food and Drug Administration advisory-committee meetings that led the agency to authorize both mRNA vaccines. “I wish that SARS-CoV-2 could be immediately treated with a shot of epinephrine!” he says.

Most of the people who experienced anaphylaxis had reacted to other substances before: about 80% of people who reacted to the Pfizer–BioNTech vaccine, and 86% to the Moderna vaccine, had a history of allergies, according to the US Centers for Disease Control and Prevention.

The specific cause of the anaphylactic reactions remains unknown, but the US National Institute of Allergy and Infectious Diseases told Nature in an e-mail that the agency has designed a clinical trial to determine the underlying mechanism, but did not specify when the trial would begin.

What could be causing the allergic reactions?

Some researchers have had their eye on polyethylene glycol (PEG) as the anaphylaxis-causing agent in the mRNA vaccines. The Moderna and Pfizer–BioNTech vaccines use hollow lipid nanoparticles to store and then deliver their mRNA payload to cells. PEG is linked to the lipids in these particles and, under normal circumstances, helps them to sneak by the immune system. Although PEG-linked molecules are found in a variety of products, such as laxatives and gout medicines, they have been known to cause allergic reactions3.Oxford COVID-vaccine paper highlights lingering unknowns about results

Follow-up studies in people who experienced anaphylaxis could help to determine whether PEG is the culprit, says Samuel Lai, a pharmaco-engineer at the University of North Carolina at Chapel Hill. If blood samples from these people contain anti-PEG antibodies, it could be an indicator, says Lai, but it is as yet unclear how long these proteins remain in the bloodstream after anaphylaxis.

Vaccines that don’t use PEG — such as the not-yet-authorized shot from Johnson & Johnson, which also uses an adenovirus to trigger immunity to the coronavirus — might be a way to vaccinate people with a sensitivity to the polymer, he adds.

Because mRNA vaccines have shown such promise, Ulrich Schubert, a polymer scientist at the University of Jena in Germany, thinks now is the time to invest in developing vaccine-compatible polymers that don’t cause allergic reactions. At the German Research Foundation-funded collaborative research center PolyTarget, where Schubert works, these studies are already in progress. “If we want to be ready for the next pandemic — which will come — we have to start now,” he says.

Reference:

Remmel, A. (2021). COVID vaccines and safety: what the research says. Nature. doi:10.1038/d41586-021-00290-x

Cross-Asset Complacency at 20-yr High

What can possibly go wrong?

Well, here’s JPM’s John Normand ,head of cross-asset strategy, (courtesy of ZeroHedge): https://www.zerohedge.com/markets/complacency-20-year-highs-jpm-models-warn-imminent-correction

Current readings for individual indicators and the composite are summarized in charts 3 and 4. In Chart 3, four of the seven cross-asset measures have moved beyond the levels that have preceded previous corrections (short and long-term valuation, positioning and price momentum); one indicator is near the average associated with corrections; (volatility risk premia); and two are below typical thresholds (ETF flows and market depth). In Chart 4, aggregate measures of complacency based on the net number of extreme signals has risen to the 98th percentile, based on patterns exhibited over the past 20 years.

Well, that’s more than 2-sigma outside the band.

Oh, and here are the Charts:

The Blackouts That Go With Going Green

With the Modern Solar Minimum upon us, better get used to colder winters over the next 3 decades.

Solar Cycle 24 (December 2008 – December 2019) is recorded as the weakest in magnitude since 1957 (Hajra, 2021). That cycle is consistent with the so-called “hiatus” that ran through 2013.

Here is how Cycle 24 fits into the long-term trends.

Cycle 25 will run ~11 years, bottoming out later in the decade. Subsequent cycles will continue past 2050 as Earth enters Eddy Minimum.

Global warming?

Well, sure, lower tropospheric temperatures are ~0.21 C above the 20 year trendline, according to satellite radiometers.

Compare that to this image of what’s ahead over the next week – courtesy of NOAA’s GFS simulations.

And, this is just the start. With solar radiance dropping over the next few decades, it will likely get worse – compounded by a weakened (and more meandering) jet stream due to the reduced irradiance.

Besides unnecessary death and economic turmoil in Texas, things are spilling over into other states and Mexico.

Here’s ZeroHedge: https://www.zerohedge.com/weather/4-million-texans-without-power-amid-grid-collapse-second-storm-nears

Update (1415 ET): Rolling blackouts and power outages have hit 15 states on Tuesday as a polar vortex dumps Arctic air into much of the country.

According to PowerOutage.US, 15 states are experiencing rolling blackouts or outages because of extreme weather. Most of the outages are seen in Texas, with over 4 million customers without power (as of this update). 

Top Areas by Outages 
Texas4,197,673
Oregon230,247
Kentucky144,615
Louisiana115,795
West Virginia95,737

The polar vortex will continue pouring frigid air into much of the country through this week. Temperature anomalies are well below normal, creating major power-grid chaos. 

The disruption has spilled over into Mexico, where the US has curbed natural gas exports, resulting in power stations grinding to a halt. 

OilPrice.com expands more on the chaos unfolding across Mexico’s northern power grid. 

The plummeting natural gas exports from the United States to Mexico amid an Arctic cold spell in the country that has led to a gas demand surge is causing blackouts in northern Mexico, with some 4.77 million households and businesses left without power on Monday.

Argus noted that most of the natural gas Mexico receives from the United States comes from the Permian, where the production of both oil and gas has been affected by the cold weather that has caused power outages across Texas.

Oil wells are being shut down, and so are refineries along the Gulf Coast, Reuters reported earlier today, adding oil and gas pipeline operations were also disrupted by the weather.

The blackouts, Bloomberg reports, will strengthen the government’s argument that Mexico needs to be less dependent on energy imports, with President Andres Manuel Lopez Obrador spearheading the drive to reduce this dependency. Obrador wants to boost Mexico’s domestic oil and gas production to tackle the problem, but this has proved challenging without the participation of private energy companies as the president seeks to fortify the dominant status of state energy major Pemex.

* * * 

The lack of gas flowing to powerplants plus unprecedented demand for power has resulted in the state’s highest-ever electricity rates. Power demand has surpassed supply leading to massive blackouts for the last couple of days. The goal now is to get power generation back online. 

* * * 

Update (1256 ET): Following the power grid collapse in Texas, Gov. Greg Abbott released a statement Tuesday that “declared the reform” of ERCOT in the new legislative session. Abbott will pressure lawmakers to investigate ERCOT’s failures and make sure rolling blackouts never happen again. 

“The Electric Reliability Council of Texas has been anything but reliable over the past 48 hours,” said Abbott. “Far too many Texans are without power and heat for their homes as our state faces freezing temperatures and severe winter weather. This is unacceptable. Reviewing the preparations and decisions by ERCOT is an emergency item so we can get a full picture of what caused this problem and find long-term solutions. I thank my partners in the House and Senate for acting quickly on this challenge, and I will work with them to enhance Texas’ electric grid and ensure that our state never experiences power outages like this again.”

Here’s the full text: 

* * * 

Update (1234 ET): ERCOT officials have promised to restore some power generation today, but according to PowerOutage.US, around 1221 ET, there are more than 4.423 million customers without electricity in the state. That’s up 100k since 0900 ET.

Bloomberg’s Javier Blas tweets out he “doesn’t have good news” concerning the power grid collapse in the state.  

“The load on the ERCOT grid is right now nearly the lowest it has been since the blackouts started more than 36 hours ago. Load climbed a bit earlier (see chart, note GMT hours), but since has fallen, which indicates blackouts have spread again.”

* * * 

Update (1208 ET): There are three major power grids in the Lower 48 states: the Eastern Interconnection, the Western Interconnection — and Texas Interconnection. 

The Texas grid is called ERCOT (Electric Reliability Council of Texas). It covers 90% of the state’s electric load except for El Paso and the upper Panhandle, and East Texas.

Local utilities under ERCOT have pledged not to sell their power to out-of-state customers. Texas grid’s independence dates back to World War II.

While there’s little pressure to integrate ERCOT into the national grid, that could all change with the latest wave of blackouts across the Lone Star State. 

* * * 

Update (1003 ET): Some Texans have been living in their cars to stay warm as rolling blackouts have left millions without power. 

CBS DFW spoke with at least one person who’s been sitting in his car since Sunday to get warm. 

Collin County resident Clint Cash has had no power in North Texas for a couple of days. He said his house went dark Sunday, which was when he decided to bundle up and sit in his parked car with the heater on full blast. 

Isha Elhence, a Dallas resident who lost power around 2 a.m. Monday, was quoted by Bloomberg as saying, “We lost power around 2 a.m. Monday. It was only supposed to be for one to two hours, which seemed manageable… Now it’s kind of indefinite with no updates, so we’re unsure of what we’re supposed to be doing.”

  “This is extremely dangerous,” said Eric Berger, a forecaster with Houston’s Space City Weather.

As the rolling blackouts increased across Texas, we noted Monday evening, internet searches for firewood exploded across the state. 

Internet searches for “where to buy firewood” erupted on Monday. 

Texas’ grid collapse has transformed the state into a third world country. 

* * * 

Update (0950 ET): With temperatures near zero this morning, GM decided to idle its massive Arlington Assembly plant due to “weather problems” for the second day. The facility sits on about 250 acres and employs approximately 5,480 people. 

There are no further updates on when the facility will reopen. Temperatures are expected to stay frigid until the end of the week. 

* * * 

Update (0915 ET): Oncor Electric Delivery, Texas’ largest transmission and electric distribution utility, tweeted:

“Due to ongoing record-low temps and generation, @ERCOT_ISO has continued to direct Oncor & utilities across TX to drop power load through maintained controlled outages. These controlled outages are occurring across the state and our entire service territory.” 

Oncor also tweeted: 

“At this time, @ERCOT_ISO is unable to predict when grid conditions will stabilize. All customers are urged to be prepared for cont’ extended outages. Please also prioritize safety. Warming stations are available in many areas- check online or call 211 for more.”

Temperatures across Texas this morning are absolutely frigid. 

At the moment, PowerOutage.US shows 4.307 million customers in Texas are without power.

* * * 

Update (0854 ET): Texas power grid operator ERCOT, which represents 90% of the state’s electric load, tweeted Tuesday morning that “generators to return, renewable output to increase = increased customer restoration.” 

Bloomberg published a headline that said the grid operator expects all power to be back on Tuesday evening. 

“It’s a function of how many generations we are able to get back on line, especially gas and coal,” Dan Woodfin, a senior director for the ERCOT, said in an interview. “It could be as early as early afternoon today. But then it is also possible it could go into the evening hours tonight.”

However, Bloomberg’s Javier Blas said the grid is “still short of at least 18.5 GW.” He said that equates to outages for at least 3 million homes. 

* * * 

Update ( 0832 ET): The Southwest Power Pool (SSP), which manages the electric grid and wholesale power market for the central US, including Kansas, Oklahoma, portions of New Mexico, Texas, Arkansas, Louisiana, South Dakota, North Dakota, Montana, Missouri, Minnesota, Iowa, Wyoming, and Nebraska, said Tuesday morning that blackouts would continue for a second day. 

Why are the ‘poor’ suburban areas dark while downtown is all lit up? 

* * * 

Four million Texans are without power Tuesday morning after a polar vortex split poured Arctic air into the region, collapsing the state’s power grid, forcing grid operators to impose rolling blackouts because of higher power demand. 

The PowerOutage.us website, which tracks power outages, said four million Texas customers were experiencing outages at 0630 ET Tuesday. 

Houston Police Chief Art Acevedo tweeted that a weather-related death was reported

Acevedo tweeted, “Please pray for our elderly and vulnerable populations tonight. With the 2nd consecutive night of massive power outages and frigid cold, many lives are at risk. State of Texas leaders must do better, lives depend on it.” 

Refinitiv data shows Texas continues to deal with Arctic air, now stretching for the fifth day. 

Below-average Texas temperatures will likely clear out by the end of the weekend.

ERCOT wholesale electricity prices topped the grid’s price cap of $9,000 per megawatt-hour several times in the overnight session. Reminding readers, ERCOT prices are usually around $25/MWh. 

Meanwhile, rolling blackouts have set off a chain reaction of problems. RT News reports “some water treatment plants and cell phone networks” are offline. 

Cellular networks started to go offline as “backup generators at towers are freezing or running out of fuel or both,” tweeted County Judge KP

Governor Greg Abbott wrote on Twitter that “Texas power grid has not been compromised.” However, millions of Texans are unhappy with his response to the grid crisis that has sparked chaos across the state. He deployed National Guard troops to assist the state in relief efforts. 

Living in Texas sounds like a third-world country. Here’s a tweet from Dallas County Judge Clay Jenkins: 

“The additional shed coupled with increased demand will likely increase blackout numbers and times. We should discuss how Texas let this happen. I understand your anger. I’m angry too. But tonight-right now- is about human and animal survival. Check on and help one another!” 

President Joe Biden declared an emergency on Monday for the Lone Star State, where temperatures in some areas hovered near zero. 

The freeze also took a toll on the state’s energy industry, the country’s largest crude refinery shuttered operations on Monday. Over the weekend, natural gas pipelines had restricted flow as wellheads froze

… and the worst might not be over as a second winter storm could batter the state by midweek. 221,9592,546

References:

Hajra, R. (2021). Weakest solar cycle of the space age: A study on solar wind–magnetosphere energy coupling and geomagnetic activity. Solar Physics296(2). doi:10.1007/s11207-021-01774-9

The New Normal: Higher VX Summer Prices and Excessive Contango in VX Futures

Evil Speculator: https://evilspeculator.com/the-new-old-normal/

Implied volatility has been dropping faster than an ACME anvil over the past two weeks, which stands in stark contrast to what I am seeing in the bonds market so the jury is still out whether or not we are looking at some bifurcation here (strange things happen sometimes) or if risk is being improperly handicapped. If it is the latter then we may see another Gamestop type situation unfold in the near term future – if it’s the former then retail traders are about to get a wedgie of biblical proportions.

On the surface everything is looking pretty hunky dory with the VIX back to pre-COVID levels, albeit the 20 mark has yet to be decisively cleared (there as a dip below it on Friday).

The implied volatility term structure is also in a quick dive pattern and I honestly cannot remember the last time I’ve seen this ratio at the 0.75 mark – it’s been at least a year.

But if you look closer you start seeing the first cracks in the armor. Note that the VIX is now near 20 with the VIX3M (formerly VXV) still all the way up at 26.5.

And that’s where things start to get really interesting. If you take a peek at the VX product depth graph then you’ll see even higher prices for VX contracts further out toward the summer. And excessive contango in the VX futures usually is the harbinger of tough times ahead.

Because according to my stats it is in fact retail that’s gobbling up VIX related positions (mostly in related ETFs like VXX or UVXY). And yes albeit it’s possible that retail has it right and the evil quants and market makers (paging HD) have it all wrong this is giving me a lot of pause.

Solar Minimum, Weakened Jet Stream, and Extended Cold Ahead

7-day NOAA GFS forecast (courtesy of Tropical Tidbits): https://www.tropicaltidbits.com/analysis/models/?model=gfs&region=us&pkg=T2ma&runtime=2021021612&fh=6

With a weakening solar cycle, no surprise we are seeing new cold records being set.

And, this is what’s ahead – a slight warming trend late-decade to be followed by a return to cold temperatures.

Arbitrage

Zero Hedge: https://www.zerohedge.com/crypto/microstrategy-selling-600-million-bonds-acquire-additional-bitcoins

MicroStrategy Is Selling $600 Million In Bonds To “Acquire Additional Bitcoins”

With Bitcoin surpassing $50,000 for the first time this morning, Business intelligence and mobile software firm MicroStrategy has announced it intends to sell bonds and use the net proceeds to “acquire additional bitcoins.”

In the last few weeks, MicroStrategy has been adding more bitcoin to its reserves (here and here most recently), and today unveiled plans to offer $600 million of convertible senior notes due 2027 in a private offering to institutional buyers.

The notes will be unsecured, senior obligations of MicroStrategy and will bear interest payable semi-annually in arrears on February 15 and August 15 of each year, beginning on August 15, 2021.

The notes will mature on February 15, 2027, unless earlier repurchased, redeemed or converted in accordance with their terms. Subject to certain conditions, on or after February 20, 2024, MicroStrategy may redeem for cash all or a portion of the notes. The notes will be convertible into cash, shares of MicroStrategy’s class A common stock, or a combination of cash and shares of MicroStrategy’s class A common stock, at MicroStrategy’s election. Prior to August 15, 2026, the notes will be convertible only upon the occurrence of certain events and during certain periods, and thereafter, at any time until the second scheduled trading day immediately preceding the maturity date. The interest rate, conversion rate, conversion price and certain other terms of the notes will be determined at the time of pricing of the offering.

MicroStrategy intends to use the net proceeds from the sale of the notes to acquire additional bitcoins.

As a reminder, MicroStrategy first disclosed it was purchasing bitcoin as a part of its treasury reserve policy in August 2020 when at the time the company purchased 21,454 bitcoin at a price of $250 million.

CEO Michael Saylor has been vocally touting bitcoin as a more superior reserve asset and store of value than the US dollar and gold.

“We find the global acceptance, brand recognition, ecosystem vitality, network dominance, architectural resilience, technical utility, and community ethos of Bitcoin to be persuasive evidence of its superiority as an asset class for those seeking a long-term store of value,” Saylor said after the intial disclosure, adding:

“Bitcoin is digital gold – harder, stronger, faster, and smarter than any money that has preceded it. We expect its value to accrete with advances in technology, expanding adoption, and the network effect that has fueled the rise of so many category killers in the modern era.”

As Coin Desk notes, in the company’s earnings call last week, Saylor had mentioned that MicroStrategy is set to “continue to actively manage” its balance sheet and “progressively acquire more bitcoin” at prices “that probably keep going up.”

“Regarding our bitcoin strategy, our pioneering decision to make bitcoin our primary treasury reserve asset has made MicroStrategy a thought leader in the cryptocurrency market and generated great interest in MicroStrategy as a corporation,” the CEO said.

Since starting its allocation into bitcoin, MicroStrategy’s stock price has increased over 750%…

This image has an empty alt attribute; its file name is bfmB44E.jpg

CCP Virus “Circulating Widely” in Wuhan in December 2019

Workers wearing protective gear are seen in the compounds of The Jade Boutique Hotel, where members of the World Health Organization (WHO) team investigating the origins of the COVID-19 pandemic are due to complete their quarantine, in Wuhan, China, on Jan. 28, 2021. (Hector Retamal/AFP via Getty Images)

Epoch Times: https://www.theepochtimes.com/who-investigators-say-ccp-virus-was-circulating-widely-in-wuhan-by-late-2019_3697310.html?utm_source=ChinaDaily&utm_medium=email&utm_campaign=2021-02-16

An investigator with the World Health Organization (WHO) said the CCP virus was “circulating widely” in WuhanChina, in late 2019.

Lead WHO investigator Peter Ben Embarek told CNN that his team found signs of a wider outbreak in the Hubei Province city in late 2019, noting that there were at least 13 strains of the CCP (Chinese Communist Party) virus, or the novel coronavirus that causes the disease COVID-19, around Wuhan by late 2019.

“The virus was circulating widely in Wuhan in December, which is a new finding,” he added, saying that around 1,000 people may have been infected at that time. “Some of them are from the markets … some of them are not linked to the markets,” he said.

“There [are] about 200,000 samples available there that are now secured and could be used for a new set of studies,” Ben Embarek said. “It would be would be fantastic if we could [work] with that.”

The new report adds to a growing body of evidence that the CCP covered up the origins of the virus and its severity during the start of the pandemic. Human rights activists have expressed concern about how CCP officials moved to silence doctors and other whistleblowers in Wuhan last year.

The CCP didn’t report on the COVID-19 outbreak until Dec. 31, 2019, to the country’s WHO office—amid speculation that a new virus was circulating in the country. On Jan. 14, 2020, the WHO passed on a CCP-backed declaration that there was “no clear evidence of human-to-human transmission” of the virus, triggering criticism against the United Nations-backed health organization.

Ben Embarek was at the center of some controversy last week when he said that a theory the virus leaked from Wuhan-based virology lab does not require more investigation. Days later, WHO Director-General Tedros Adhanom Ghebreyesus on Feb. 12 appeared to walk back that claim and said more investigation is needed.

“The independent expert team to study the origins of the COVID-19 virus has completed its trip to China … The expert team is still working on its final report, and we look forward to receiving both the report and a full briefing,” Tedros remarked, while adding that the investigation has “been a very important scientific exercise in very difficult circumstances.

He went on to say, “Some questions have been raised as to whether some hypotheses have been discarded. I want to clarify that all hypotheses remain open and require further study.”

report from The Associated Press stated that Ben Embarek and other WHO officials were tightly controlled by the CCP during their visit to Wuhan.

This prompted Gordon Chang, author of “The Coming Collapse of China” and notable China critic, told The Epoch Times that the mission was designed to fail.

“This is a parroting of a Beijing narrative,” Chang told The Epoch Times’ “American Thought Leaders” program. “This just shows you that the WHO mission is completely worthless—actually is worse than worthless because it’s throwing people off the trail.”

Limits to Growth and Freefallen Population

Chris Hamilton (Econimica) explains the “free-fallen” reality of depopulation dynamics: https://econimica.blogspot.com/2021/02/global-depopulation-two-paths-one.html

My points of emphasis in bold.

Global Depopulation – Two paths, One Destination

Play along with me while we consider the ultimate barometers of economic wellbeing that are fertility rates and births across the developed world, China, and the RoW (rest of the world).  How fertility rates have freefallen to predominantly negative rates. How the developed nations fertility rates turned negative first, then China, then most the RoW (& soon nearly the entire world).

A quick perusal of the chart of global fertility rates, by income groups below, shows a sharp and sustained drop in global fertility since 1970. It is well understood how (and why) China did this…less well understood how (and why) the developed world got there first and has sustained it for decades. My supposition is that declining fertility rates worldwide are primarily due to central bank set interest rate policies which have consistently encouraged debt and asset inflation well ahead of real income inflation. These rising costs of living have particularly punished those with little or no offsetting assets…chief among these, young adults among the childbearing population. The decades long squeeze has slowed marriages to a crawl and sent births tumbling. Given family formation and childbirth are a choice now with widely available contraception…the choice is increasingly, no.

Data below is from UN World Population Prospects 2019…future fertility and birth estimates are a more realistic average between UN median and low estimates.

Below, annual births per income groupings (plus average group gross national incomes per capita are called out). Births only continue to rise among the very poorest, and least able to consume. Births among all other income groups are in secular decline.

Perhaps it’s time to consider what role the Federal Reserve and developed nation central banks have had in this collapse…particularly versus the Chinese population control approach of a one child policy?  The developed nations, via interest rate policy, appear to have achieved consistently lower birth rates than China’s autocratic approach. Given the stated central bank focus of environmentalism, clearly the most important component in controlling emissions, resource depletion, etc. is controlling the quantity of consumers (particularly among those that have high rates of consumption). It has been five decades in the turning of this ship…but now organic demand (quantity of 0 to 65 year old consumers w/ capability to consume) is set to fall indefinitely. Absent the population/consumer growth of the consumer nations, there is no transmission mechanism for lower middle and low income nations to export there way to higher gross national incomes, per capita. In fact, the lower middle and low income nations are likely to see their portion of the pie begin falling dramatically as developed demand for their goods and labor consistently wanes.

Below, the female childbearing populations of the differing income groupings. The long declining female childbearing populations of the developed (despite immigration) coupled with severely negative fertility rates versus the decelerating childbearing growth and decelerating fertility rates of the lower middle (India, etc.) and low income groupings. Like most things, there is likely a tipping point at which the lack of organic population/consumer growth can no longer be hidden by debt and population growth among the poor and elderly. We are likely there.

Seventy years of Federal Reserve interest rate policy managing the dollar as the global reserve currency…with two distinct periods. Thirty years of interest rate hikes, followed by 40 years of interest rates cuts. Below, I chart this interest rate against the basis of global demand represented by the high and low income global child bearing populations, and resultant debt that declining rates have fostered.

Looking at the same groupings, but on a year over year change basis. It appears that changing global demand (inflation) and the annual change in the global childbearing consumer population have moved in sync for…seven decades. This doesn’t seem to be a coincidence. Essentially, rates were hiked while demand growth was rapidly rising, suffocating commensurate capacity growth…pushing inflation and turning a growing population away from further population growth. Then as demand growth was decelerating, rates were dropped encouraging oversupply of new capacity…and deflation.  Almost simultaneous to the onset of the declining childbearing population, ZIRP was initiated. ZIRP has ushered in asset hyper-inflation (enriching primarily institutional and elderly asset holders) amid stagflation and population decline among the consumer childbearing population…and decelerating growth among the low consumer nations childbearing population.

Looking at the wider consumer vs. low-consumer under 65 year old populations, FFR%, and resultant debt. The consumer supertanker, that is the consumer under 65 year old population, has turned downward…even inclusive of immigration (factored into the chart below). The decades of interest rate cuts until arriving at ZIRP and the resultant inverse relationship of debt growth are fairly easy to see…and only when viewing their impact on population growth can their true purpose be seen.

Looking at the same as above, except on a year over year annual change basis. ZIRP, exploding debt (resulting in asset hyper-inflation), and global consumer depopulation are no coincidence.

Lastly, where the majority of global population growth is happening among the elderly…essentially an echo of where the world was almost seven decades ago except this population is living decades longer than the generations that came before them. But growth among this population is massively deflationary as elderly are credit averse and tend to pay down/off their debts…essentially destroying currency faster than the young population can create money via new debt.

It would appear that the seven decades of global reserve currency management coinciding with the unprecedented downturn in fertility, births, and population growth are highly correlated. The power to artificially determine interest rates, rather than trust in a free market, has reverberations throughout business, finance, and economics. But interest rate policy also seems to have guided birth rates and ultimately the population of this planet. Like most things, I doubt the Federal Reserve would even dignify this with a comment or discussion…but the data suggesting the Federal Reserve (BoJ, ECB, BoE, etc.) has, is, and will likely continue to be guiding depopulation (in like goal to China…but differing in method), while simultaneously choosing winners/losers for decades to come, seems fairly compelling.

In case there are still those that wonder at the transmission of declining interest rates/ZIRP…to debt creation…to asset appreciation…absent resultant GDP growth…please study the charts below charts of the Wilshire 5000 (representing all US equity) which has now doubled GDP. And finally the impact of shifting wealth to the few on the births among the many.

Focus on the Wilshire 5000 (representing soaring US asset inflation).

Finally, who is winning/losing based on asset inflation…chart below shows surging net worth of the top 10% of Americans (now owning over 70% of total wealth) versus declining portion among those with little to no assets (bottom 90% of Americans now holding less than 30% of the pie).

Portion of net worth by top 10% / bottom 90% versus annual US births.

Gauging US annual births (regardless parents status as legal/illegal) versus Federal Funds Rate, US marketable debt, Federal Reserve’s balance sheet (below).

And dividing the future responsible for paying/servicing that debt (annual births) vs. the sins of the past that will be their lifelong yoke. Looking more like Bitcoin or what gold/silver would look like if their paper versions weren’t being rehypothecated even faster than currency dilution. At some point, young will refuse to carry that weight any longer (and the $ will likely suddenly, violently become worthless in terms of fixed quantities of things like physical gold/silver).

Invest accordingly!!!…even if it may be the foundation of the second American civil war (dancing in an immoral system as long as the music plays)!?!

Циркон

Image result for zircon missile

Wiki: https://en.wikipedia.org/wiki/3M22_Zircon

Zircon is believed to be a maneuvering, winged hypersonic cruise missile with a lift-generating center body. A booster stage with solid-fuel engines accelerates it to supersonic speeds, after which a scramjet motor with liquid-fuel (JP-10 Jet fuel) in the second stage accelerates it to hypersonic speeds.

The missile’s range is estimated to be 135 to 270 nautical miles (155 to 311 mi; 250 to 500 km) at low level, and up to 400 nmi (460 mi; 740 km) in a semi-ballistic trajectory; average range is around 400–450 km (250–280 mi; 220–240 nmi). According to Russian media (2017), the longest possible range is 540 nmi (620 mi; 1,000 km) and for this purpose a new fuel was created. In the 2020 test, Ministry of Defense of the Russia claimed the missile’s range is estimated to 1,000 – 2,000 km (depend on the type of target)

Zircon can travel at a speed of Mach 8–Mach 9 (6,090–6,851 mph; 9,800–11,025 km/h; 2,722.3–3,062.6 m/s). This has led to concerns that it could penetrate existing naval defense systems. Zircon exchanges information in flight and can be controlled by commands if necessary.

Zircon will be first deployed with the Kirov-class battlecruisers Admiral Nakhimov and Pyotr Velikiy after 2020. The ships will have their P-700 Granit anti-ship missiles replaced with the 3S14 universal VLS cells capable of carrying the Oniks, Kalibr and Zircon anti-ship cruise missiles; each vessel is to be equipped with 72 such missiles. After completion of their refit, the ships could carry 40–80 anti-ship cruise missiles of different types. Other platforms are likely to include Russian Navy’s Admiral Grigorovich class and Admiral Gorshkov class frigates, as well as Gremyashchiy class, Buyan class and Karakurt class corvettes, mainly due to the installation of the compatible 3S14 vertical launchers.

Andrei Martyanov: https://smoothiex12.blogspot.com/2020/10/about-zircon-again.html

There is no technological solution for stopping this type of weapons  in the US currently. Ramifications are colossal: generally, it will be slow arduous reshaping of surface fleets towards smaller (frigate size) strike platforms. For Russian Navy, Zircon unties hands in terms of Sea Control not only in littoral and Green Water zones but, upon necessity, in the remote or ocean zone, allowing to guard surface strike groups against any attempts of US Navy to bring to bear its CBGs’ fire power. Thus aircraft carriers are finally removed to the niche where they belong–primarily a power projection tool against unstable entities. Obviously a gigantic expenditure of building and maintaining any US Navy’s CBG  raises the serious question about a validity of the approach of having roughly $20 billion worth of hardware (CVN+escort ships+air wing) being commensurate with a rather very limited tasks this insanely expensive force can perform under present conditions. It is too expensive to bomb some shithole of a country somewhere, but attacking Russia? What a wonderful collection of expensive, prestigious targets.